In a Pew Research poll, 287 out of 522 randomly selected U.S. men were able to identify Egypt when it was highlighted on a map of the Middle East. When 520 randomly selected U.S. women were asked, 233 were able to do so. Construct and interpret a 95% confidence interval for the difference in the true proportion of U.S. men and U.S. women who can identify Egypt on a map. (0.499) (0.501) 0.102 ± 2.576. 1042 We are 95% confident that the interval from 0.062 to 0.142 captures pi – P2 = the true difference in the proportions of men and women who can identify Egypt on a map. (0.55) (0.45) (0.448) (0.552) (0.550 – 0.448) ± 1.961 522 520 We are 95% confident that the interval from 0.042 to 0.160 captures p1 – p2 = the true difference in the proportions of men and women who can identify Egypt on a map. |(0.499) (0.501) 0.102 + 1.961 1042 We are 95% confident that the interval from 0.072 to 0.132 captures pi – P2 = the true difference in the proportions of men and women who can identify Egypt on a map. (0.55) (0.45) (0.448) (0.552) (0.550 – 0.448) ± 2.5761 522 520 We are 95% confident that the interval from 0.041 to 0.162 captures p1 – P2 = the true difference in the proportions of men and women who can identify Egypt on a map.
In a Pew Research poll, 287 out of 522 randomly selected U.S. men were able to identify Egypt when it was highlighted on a map of the Middle East. When 520 randomly selected U.S. women were asked, 233 were able to do so. Construct and interpret a 95% confidence interval for the difference in the true proportion of U.S. men and U.S. women who can identify Egypt on a map. (0.499) (0.501) 0.102 ± 2.576. 1042 We are 95% confident that the interval from 0.062 to 0.142 captures pi – P2 = the true difference in the proportions of men and women who can identify Egypt on a map. (0.55) (0.45) (0.448) (0.552) (0.550 – 0.448) ± 1.961 522 520 We are 95% confident that the interval from 0.042 to 0.160 captures p1 – p2 = the true difference in the proportions of men and women who can identify Egypt on a map. |(0.499) (0.501) 0.102 + 1.961 1042 We are 95% confident that the interval from 0.072 to 0.132 captures pi – P2 = the true difference in the proportions of men and women who can identify Egypt on a map. (0.55) (0.45) (0.448) (0.552) (0.550 – 0.448) ± 2.5761 522 520 We are 95% confident that the interval from 0.041 to 0.162 captures p1 – P2 = the true difference in the proportions of men and women who can identify Egypt on a map.

College Algebra (MindTap Course List)
12th Edition
ISBN:9781305652231
Author:R. David Gustafson, Jeff Hughes
Publisher:R. David Gustafson, Jeff Hughes
Chapter8: Sequences, Series, And Probability
Section8.7: Probability
Problem 58E: What is meant by the sample space of an experiment?

Related questions
Question
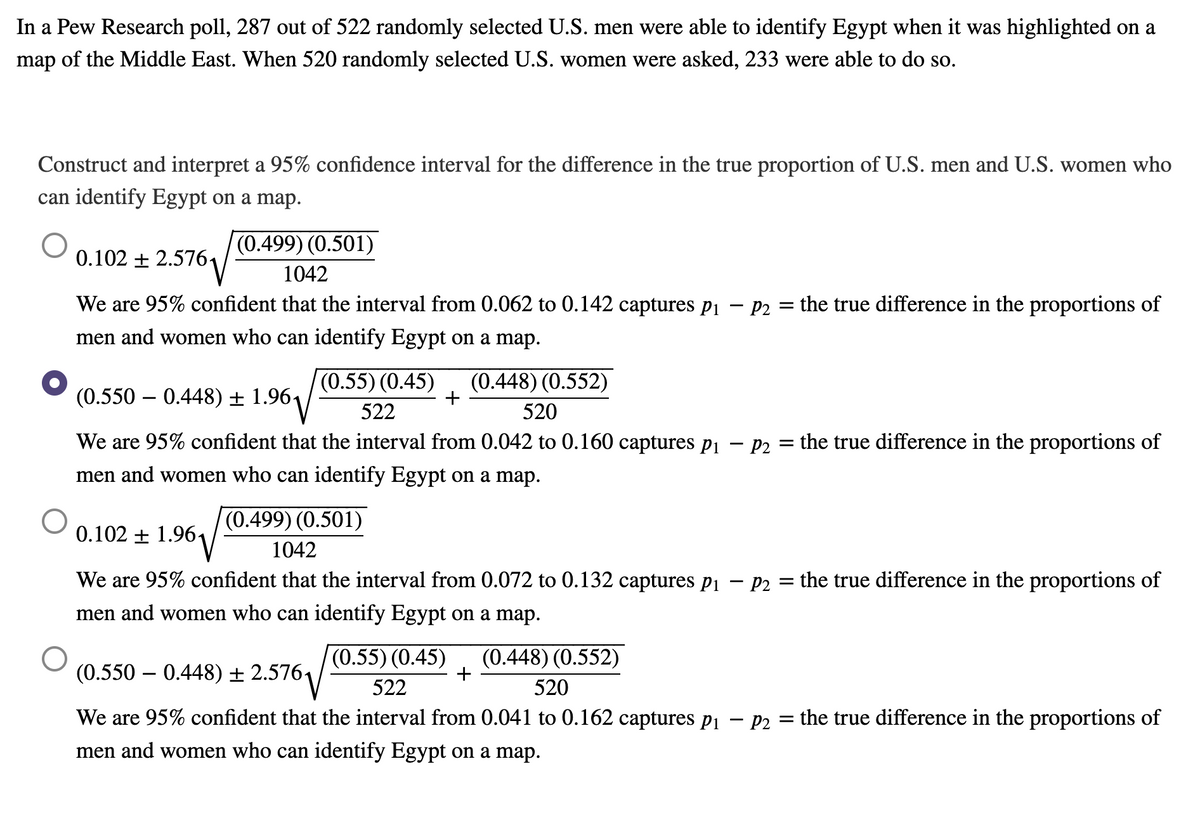
Transcribed Image Text:In a Pew Research poll, 287 out of 522 randomly selected U.S. men were able to identify Egypt when it was highlighted on a
map of the Middle East. When 520 randomly selected U.S. women were asked, 233 were able to do so.
Construct and interpret a 95% confidence interval for the difference in the true proportion of U.S. men and U.S. women who
can identify Egypt on a map.
(0.499) (0.501)
0.102 + 2.5761
1042
We are 95% confident that the interval from 0.062 to 0.142 captures p1 – P2 = the true difference in the proportions of
men and women who can identify Egypt on a map.
(0.55) (0.45)
(0.448) (0.552)
(0.550 – 0.448) ± 1.961
522
520
We are 95% confident that the interval from 0.042 to 0.160 captures p1 – p2 = the true difference in the proportions of
men and women who can identify Egypt on a map.
(0.499) (0.501)
0.102 + 1.961
1042
We are 95% confident that the interval from 0.072 to 0.132 captures pi – P2
= the true difference in the proportions of
men and women who can identify Egypt on a map.
(0.55) (0.45)
(0.448) (0.552)
+
(0.550 – 0.448) ± 2.5761
-
522
520
We are 95% confident that the interval from 0.041 to 0.162 captures pi – P2 = the true difference in the proportions of
men and women who can identify Egypt on a map.
Expert Solution
This question has been solved!
Explore an expertly crafted, step-by-step solution for a thorough understanding of key concepts.

This is a popular solution!

Trending now
This is a popular solution!

Step by step
Solved in 2 steps with 1 images

Recommended textbooks for you
College Algebra (MindTap Course List)
Algebra
ISBN:
9781305652231
Author:
R. David Gustafson, Jeff Hughes
Publisher:
Cengage Learning
College Algebra (MindTap Course List)
Algebra
ISBN:
9781305652231
Author:
R. David Gustafson, Jeff Hughes
Publisher:
Cengage Learning