The following table lists the prices of a small market basket purchased in both 2008 and 2018. Assuming that this basket of goods is representative of all goods and services, compute the price of the market basket in (a) 2008 and (b) 2018 and then answer two questions about price levels and real income. Item Coffee Tuition Pizza Movie download Gasoline - Quantity 20 pounds 1 year 100 pizzas 90 movies 1,000 gallons Price per Unit 2008 2018 $9 $10 10,000 14.000 14 2 13 4 2 3 Total 2008 a. Cost of Market Basket in 2008 (Quantity 2008 price) 180 10,000 1,300 360 2,000 13,840 $ $ $ $ $ Instructions: Round your response to two decimal places c. By how much has the average price level risen between 2008 and 2018? Hint Compare the total basket cost in 2018 to the total basket cost in 2008. Total 2018 b. Cost of Market Basket in 2018 (Quantity 2018 price) 200 14,000 1,400 180 3,000 18,780 $ $ $ $
The following table lists the prices of a small market basket purchased in both 2008 and 2018. Assuming that this basket of goods is representative of all goods and services, compute the price of the market basket in (a) 2008 and (b) 2018 and then answer two questions about price levels and real income. Item Coffee Tuition Pizza Movie download Gasoline - Quantity 20 pounds 1 year 100 pizzas 90 movies 1,000 gallons Price per Unit 2008 2018 $9 $10 10,000 14.000 14 2 13 4 2 3 Total 2008 a. Cost of Market Basket in 2008 (Quantity 2008 price) 180 10,000 1,300 360 2,000 13,840 $ $ $ $ $ Instructions: Round your response to two decimal places c. By how much has the average price level risen between 2008 and 2018? Hint Compare the total basket cost in 2018 to the total basket cost in 2008. Total 2018 b. Cost of Market Basket in 2018 (Quantity 2018 price) 200 14,000 1,400 180 3,000 18,780 $ $ $ $

Chapter10: Inventory
Section: Chapter Questions
Problem 1PA: When prices are rising (inflation), which costing method would produce the highest value for gross...

Related questions
Question
Ur
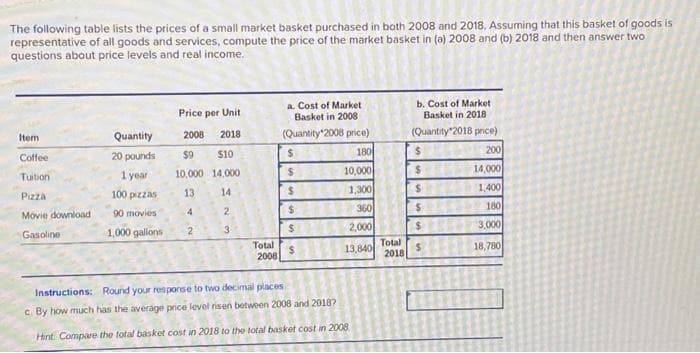
Transcribed Image Text:The following table lists the prices of a small market basket purchased in both 2008 and 2018. Assuming that this basket of goods is
representative of all goods and services, compute the price of the market basket in (a) 2008 and (b) 2018 and then answer two
questions about price levels and real income.
Item
Coffee
Tuition
Pizza
Movie download
Gasoline
Quantity
20 pounds
1 year
100 pizzas
90 movies
1,000 gallons
Price per Unit
2008
$9
$10
10,000 14.000
13
14
4
2
2
2018
3
Total
2008
a. Cost of Market
Basket in 2008
(Quantity 2008 price)
180
10,000
1,300
$
$
$
$
$
$
360
2,000
13,840
Instructions:
Round your response to two decimal places
c. By how much has the average price level risen between 2008 and 2018?
Hint Compare the total basket cost in 2018 to the total basket cost in 2008.
Total
2018
b. Cost of Market
Basket in 2018
(Quantity 2018 price)
$
$
$
200
14,000
1,400
180
3,000
18,780
Expert Solution
This question has been solved!
Explore an expertly crafted, step-by-step solution for a thorough understanding of key concepts.

This is a popular solution!

Trending now
This is a popular solution!

Step by step
Solved in 3 steps with 1 images

Knowledge Booster


Learn more about
Need a deep-dive on the concept behind this application? Look no further. Learn more about this topic, accounting and related others by exploring similar questions and additional content below.Recommended textbooks for you
Principles of Accounting Volume 1
Accounting
ISBN:
9781947172685
Author:
OpenStax
Publisher:
OpenStax College
Principles of Accounting Volume 1
Accounting
ISBN:
9781947172685
Author:
OpenStax
Publisher:
OpenStax College