The following table represents the number of hours of pain relief provided by 4 different brands of muscle relief pain tablets administered to 20 subjects. The 20 subjects were randomly divided into 4 groups and each group was treated with a different brand. Test the hypothesis at the 1% level of significance that the mean number of hours of relief provided by the tablets is the same for all four brands. Brand A Brand B Brand C Brand D 4 8 7 9. 3. 3 6 4 4 4 4.
The following table represents the number of hours of pain relief provided by 4 different brands of muscle relief pain tablets administered to 20 subjects. The 20 subjects were randomly divided into 4 groups and each group was treated with a different brand. Test the hypothesis at the 1% level of significance that the mean number of hours of relief provided by the tablets is the same for all four brands. Brand A Brand B Brand C Brand D 4 8 7 9. 3. 3 6 4 4 4 4.

Holt Mcdougal Larson Pre-algebra: Student Edition 2012
1st Edition
ISBN:9780547587776
Author:HOLT MCDOUGAL
Publisher:HOLT MCDOUGAL
Chapter11: Data Analysis And Probability
Section: Chapter Questions
Problem 8CR

Related questions
Question
100%
a. What is the appropriate null hypothesis for this test?
b. What is the F-critical value?
c. What is the F-computed?
d. What is the p-value?
e. What would be the correct decision at 1% level of significance?
f. What would be the F-critical value if the significance level is at 5%?
g. What would be the correct decision at a 5% level of significance?
Transcribed Image Text:Description:
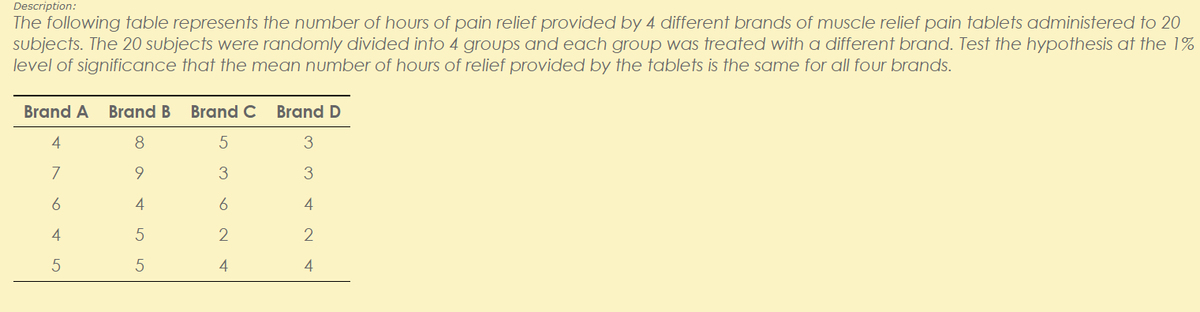
The following table represents the number of hours of pain relief provided by 4 different brands of muscle relief pain tablets administered to 20
subjects. The 20 subjects were randomly divided into 4 groups and each group was treated with a different brand. Test the hypothesis at the 1%
level of significance that the mean number of hours of relief provided by the tablets is the same for all four brands.
Brand A
Brand B
Brand C
Brand D
8
7
9
3
4
6
4
4
5
2
4
4
Expert Solution
This question has been solved!
Explore an expertly crafted, step-by-step solution for a thorough understanding of key concepts.

Step by step
Solved in 2 steps with 4 images

Recommended textbooks for you
Holt Mcdougal Larson Pre-algebra: Student Edition…
Algebra
ISBN:
9780547587776
Author:
HOLT MCDOUGAL
Publisher:
HOLT MCDOUGAL
Holt Mcdougal Larson Pre-algebra: Student Edition…
Algebra
ISBN:
9780547587776
Author:
HOLT MCDOUGAL
Publisher:
HOLT MCDOUGAL