The following table shows a money demand schedule, which is the quantity of money demanded at various price levels ( P ). Fill in the Value of Money column in the following table. Price Level (P) Value of Money (1/P) Quantity of Money Demanded (Billions of dollars) 1.00 ______ 1.5 1.33 _______2.0 2.00 _______3.5 4.00 _______ 7.0 Now consider the relationship between the price level and the quantity of money that people demand. The lower the price level, the money the typical transaction requires, and the money people will wish to hold in the form of currency or demand deposits. Assume that the Fed initially fixes the quantity of money supplied at $3.5 billion. Use the orange line (square symbol) to plot the initial money supply ( MS1 ) set by the Fed. Then, referring to the previous table, use the blue connected points (circle symbol) to graph the money demand curve.


The following table shows a money
Fill in the Value of Money column in the following table.
Price Level (P) Value of Money (1/P) Quantity of Money Demanded (Billions of dollars)
1.00 ______ 1.5
1.33 _______2.0
2.00 _______3.5
4.00 _______ 7.0
Now consider the relationship between the price level and the quantity of money that people demand. The lower the price level, the money the typical transaction requires, and the money people will wish to hold in the form of currency or demand deposits.
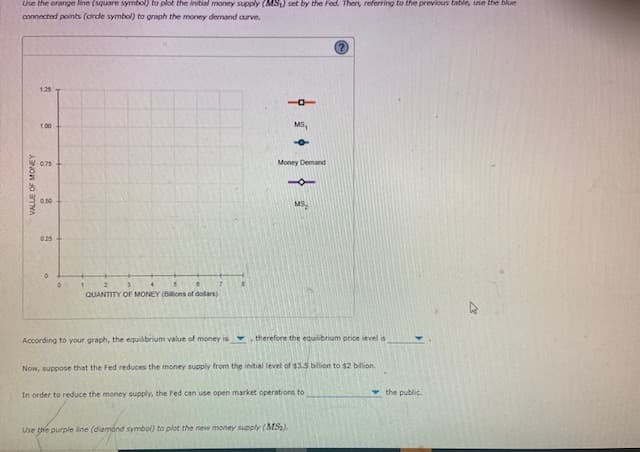
Assume that the Fed initially fixes the quantity of money supplied at $3.5 billion.
Use the orange line (square symbol) to plot the initial money supply ( MS1 ) set by the Fed. Then, referring to the previous table, use the blue connected points (circle symbol) to graph the money demand curve.


Trending now
This is a popular solution!

Step by step
Solved in 4 steps with 3 images


