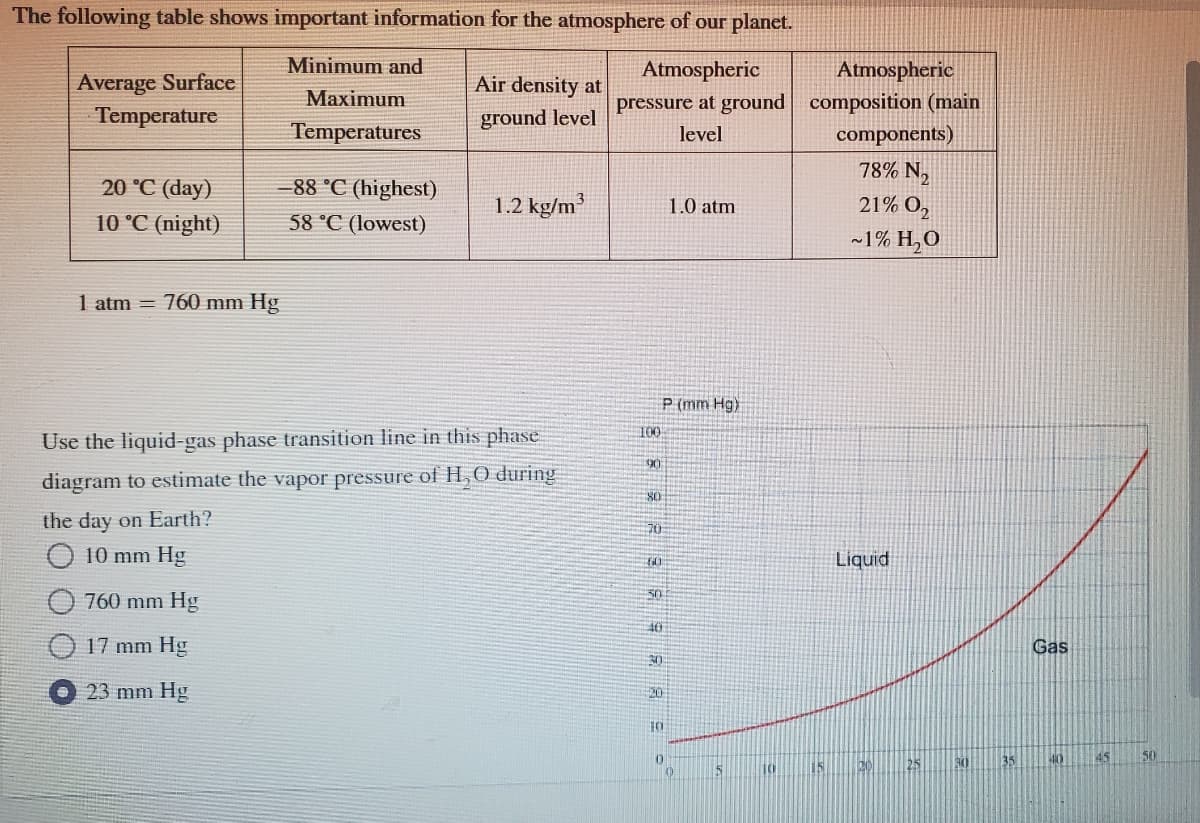
The following table shows important information for the atmosphere of our planet. Minimum and Atmospheric Atmospheric Average Surface Temperature Air density at Maximum pressure at ground composition (main components) ground level Temperatures level 78% N2 20 °C (day) 88 °C (highest) 1.2 kg/m 21% O, 1.0 atm 10 °C (night) 58 °C (lowest) ~1% H,O 1 atm = 760 mm Hg P (mm Hg) 100 Use the liquid-gas phase transition line in this phase 90 diagram to estimate the vapor pressure of H,0 during 80 the day on Earth? 70 O 10 mm Hg Liquid O 760 mm Hg 40 O 17 mm Hg Gas 30 23 mm Hg 50 40


States of Matter
The substance that constitutes everything in the universe is known as matter. Matter comprises atoms which in turn are composed of electrons, protons, and neutrons. Different atoms combine together to give rise to molecules that act as a foundation for all kinds of substances. There are five states of matter based on their energies of attraction, namely solid, liquid, gases, plasma, and BEC (Bose-Einstein condensates).
Chemical Reactions and Equations
When a chemical species is transformed into another chemical species it is said to have undergone a chemical reaction. It consists of breaking existing bonds and forming new bonds by changing the position of electrons. These reactions are best explained using a chemical equation.


Trending now
This is a popular solution!

Step by step
Solved in 2 steps


