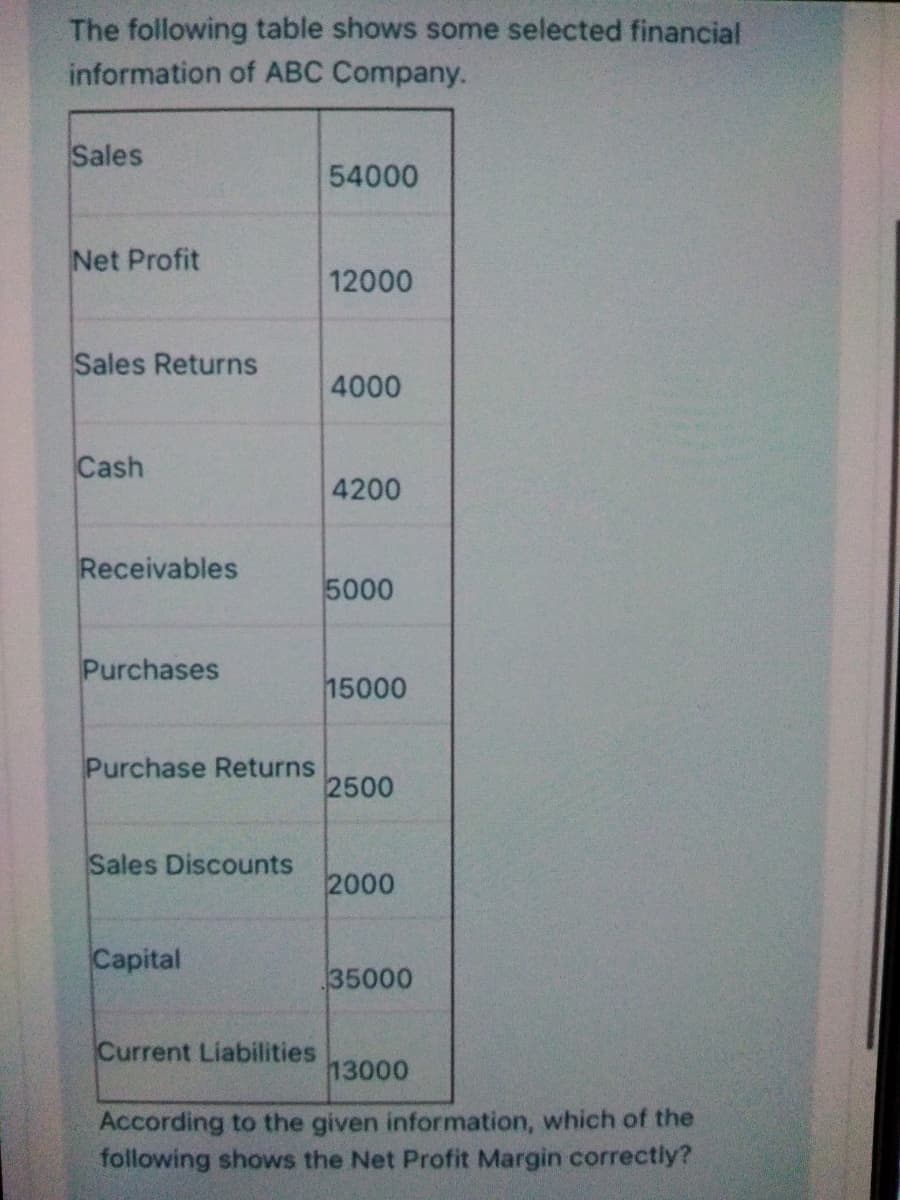
The following table shows some selected financial information of ABC Company. Sales 54000 Net Profit 12000 Sales Returns 4000 Cash 4200 Receivables 5000 Purchases 15000 Purchase Returns 2500 Sales Discounts 2000 Capital 35000 Current Liabilities 13000 According to the given information, which of the following shows the Net Profit Margin correctly?
The following table shows some selected financial information of ABC Company. Sales 54000 Net Profit 12000 Sales Returns 4000 Cash 4200 Receivables 5000 Purchases 15000 Purchase Returns 2500 Sales Discounts 2000 Capital 35000 Current Liabilities 13000 According to the given information, which of the following shows the Net Profit Margin correctly?

Survey of Accounting (Accounting I)
8th Edition
ISBN:9781305961883
Author:Carl Warren
Publisher:Carl Warren
Chapter9: Metric-analysis Of Financial Statements
Section: Chapter Questions
Problem 9.17E: Profitability metrics The following selected data were taken from the financial statements of The...

Related questions
Question
Transcribed Image Text:The following table shows some selected financial
information of ABC Company.
Sales
54000
Net Profit
12000
Sales Returns
4000
Cash
4200
Receivables
5000
Purchases
15000
Purchase Returns
2500
Sales Discounts
2000
Capital
35000
Current Liabilities
13000
According to the given information, which of the
following shows the Net Profit Margin correctly?
Expert Solution
This question has been solved!
Explore an expertly crafted, step-by-step solution for a thorough understanding of key concepts.

Step by step
Solved in 4 steps

Knowledge Booster


Learn more about
Need a deep-dive on the concept behind this application? Look no further. Learn more about this topic, finance and related others by exploring similar questions and additional content below.Recommended textbooks for you
Survey of Accounting (Accounting I)
Accounting
ISBN:
9781305961883
Author:
Carl Warren
Publisher:
Cengage Learning

Fundamentals of Financial Management, Concise Edi…
Finance
ISBN:
9781305635937
Author:
Eugene F. Brigham, Joel F. Houston
Publisher:
Cengage Learning

Fundamentals Of Financial Management, Concise Edi…
Finance
ISBN:
9781337902571
Author:
Eugene F. Brigham, Joel F. Houston
Publisher:
Cengage Learning
Survey of Accounting (Accounting I)
Accounting
ISBN:
9781305961883
Author:
Carl Warren
Publisher:
Cengage Learning
Fundamentals of Financial Management, Concise Edi…
Finance
ISBN:
9781305635937
Author:
Eugene F. Brigham, Joel F. Houston
Publisher:
Cengage Learning
Fundamentals Of Financial Management, Concise Edi…
Finance
ISBN:
9781337902571
Author:
Eugene F. Brigham, Joel F. Houston
Publisher:
Cengage Learning

Fundamentals of Financial Management, Concise Edi…
Finance
ISBN:
9781285065137
Author:
Eugene F. Brigham, Joel F. Houston
Publisher:
Cengage Learning

Financial Reporting, Financial Statement Analysis…
Finance
ISBN:
9781285190907
Author:
James M. Wahlen, Stephen P. Baginski, Mark Bradshaw
Publisher:
Cengage Learning

Financial And Managerial Accounting
Accounting
ISBN:
9781337902663
Author:
WARREN, Carl S.
Publisher:
Cengage Learning,