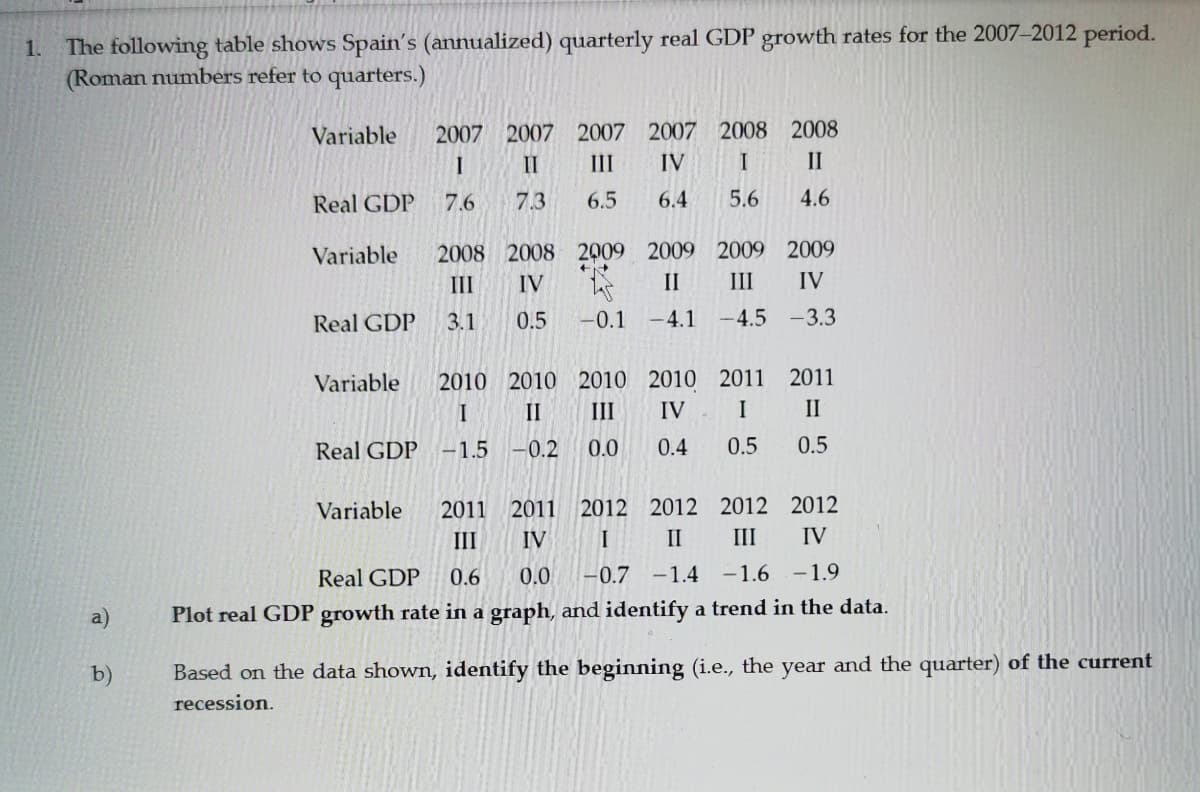
The following table shows Spain's (annualized) quarterly real GDP growth rates for the 2007-2012 period. (Roman numbers refer to quarters.) 2007 2007 2007 2007 2008 2008 II Variable II III IV Real GDP 7.6 7.3 6.5 6.4 5.6 4.6 2008 2008 2009 2009 2009 2009 IV Variable II IV II III Real GDP 3.1 0.5 -0.1 -4.1 -4.5 -3.3 Variable 2010 2010 2010 2010 2011 2011 II III IV I II Real GDP -1.5 -0.2 0.0 0.4 0.5 0.5 Variable 2011 2011 2012 2012 2012 2012 III IV II III IV Real GDP 0.6 0.0 -0.7 -1.4 -1.6 -1.9 a) Plot real GDP growth rate in a graph, and identify a trend in the data. b) Based on the data shown, identify the beginning (i.e., the year and the quarter) of the current recession.
The following table shows Spain's (annualized) quarterly real GDP growth rates for the 2007-2012 period. (Roman numbers refer to quarters.) 2007 2007 2007 2007 2008 2008 II Variable II III IV Real GDP 7.6 7.3 6.5 6.4 5.6 4.6 2008 2008 2009 2009 2009 2009 IV Variable II IV II III Real GDP 3.1 0.5 -0.1 -4.1 -4.5 -3.3 Variable 2010 2010 2010 2010 2011 2011 II III IV I II Real GDP -1.5 -0.2 0.0 0.4 0.5 0.5 Variable 2011 2011 2012 2012 2012 2012 III IV II III IV Real GDP 0.6 0.0 -0.7 -1.4 -1.6 -1.9 a) Plot real GDP growth rate in a graph, and identify a trend in the data. b) Based on the data shown, identify the beginning (i.e., the year and the quarter) of the current recession.

Chapter20: Economic Growth In The Global Economy
Section: Chapter Questions
Problem 3P

Related questions
Question
Please answer a and b
Transcribed Image Text:1. The following table shows Spain's (annualized) quarterly real GDP growth rates for the 2007-2012 period.
(Roman numbers refer to quarters.)
2007 2007 2007 2007 2008 2008
II
Variable
II
III
IV
Real GDP
7.6
7.3
6.5
6.4
5.6
4.6
Variable
2008 2008 2009 2009 2009 2009
III
IV
II
III
IV
Real GDP
3.1
0.5
-0.1 -4.1
-4.5 -3.3
2010 2010 2010 2010 2011 2011
II
Variable
II
III
IV
I
Real GDP -1.5 -0.2
0.0
0.4
0.5
0.5
2011 2011 2012 2012 2012 2012
IV
Variable
III
IV
II
III
Real GDP
0.6
0
-0.7 -1.4 -1.6 -1.9
a)
Plot real GDP growth rate in a graph, and identify a trend in the data.
b)
Based on the data shown, identify the beginning (i.e., the year and the quarter) of the current
recession.
Expert Solution
This question has been solved!
Explore an expertly crafted, step-by-step solution for a thorough understanding of key concepts.

Step by step
Solved in 2 steps with 1 images

Knowledge Booster


Learn more about
Need a deep-dive on the concept behind this application? Look no further. Learn more about this topic, economics and related others by exploring similar questions and additional content below.Recommended textbooks for you
Exploring Economics
Economics
ISBN:
9781544336329
Author:
Robert L. Sexton
Publisher:
SAGE Publications, Inc

Essentials of Economics (MindTap Course List)
Economics
ISBN:
9781337091992
Author:
N. Gregory Mankiw
Publisher:
Cengage Learning

Brief Principles of Macroeconomics (MindTap Cours…
Economics
ISBN:
9781337091985
Author:
N. Gregory Mankiw
Publisher:
Cengage Learning
Exploring Economics
Economics
ISBN:
9781544336329
Author:
Robert L. Sexton
Publisher:
SAGE Publications, Inc
Essentials of Economics (MindTap Course List)
Economics
ISBN:
9781337091992
Author:
N. Gregory Mankiw
Publisher:
Cengage Learning
Brief Principles of Macroeconomics (MindTap Cours…
Economics
ISBN:
9781337091985
Author:
N. Gregory Mankiw
Publisher:
Cengage Learning

Principles of Economics 2e
Economics
ISBN:
9781947172364
Author:
Steven A. Greenlaw; David Shapiro
Publisher:
OpenStax


Economics (MindTap Course List)
Economics
ISBN:
9781337617383
Author:
Roger A. Arnold
Publisher:
Cengage Learning