The following table shows the actual demand observed over the last 11 years: 1 Year Demand 7 2 9 Year 1 Forecast 6.0 2 Year Forecast 3 6 3 4 10 4 5 12 5 Using exponential smoothing with x = 0.30 and a forecast for year 1 of 6.0, provide the forecast from periods 2 through 12 (round your responses to one decimal place). 6 7 6 7 12 7 8 12 8 9 9 10 9 9 10 Provide the forecast from periods 2 through 12 using the naive approach (enter your responses as whole numbers). 2 3 4 5 6 7 8 9 10 11 11 11 8 12 12
The following table shows the actual demand observed over the last 11 years: 1 Year Demand 7 2 9 Year 1 Forecast 6.0 2 Year Forecast 3 6 3 4 10 4 5 12 5 Using exponential smoothing with x = 0.30 and a forecast for year 1 of 6.0, provide the forecast from periods 2 through 12 (round your responses to one decimal place). 6 7 6 7 12 7 8 12 8 9 9 10 9 9 10 Provide the forecast from periods 2 through 12 using the naive approach (enter your responses as whole numbers). 2 3 4 5 6 7 8 9 10 11 11 11 8 12 12

Practical Management Science
6th Edition
ISBN:9781337406659
Author:WINSTON, Wayne L.
Publisher:WINSTON, Wayne L.
Chapter13: Regression And Forecasting Models
Section13.6: Moving Averages Models
Problem 19P: The file P13_19.xlsx contains the weekly sales of a particular brand of paper towels at a...

Related questions
Question
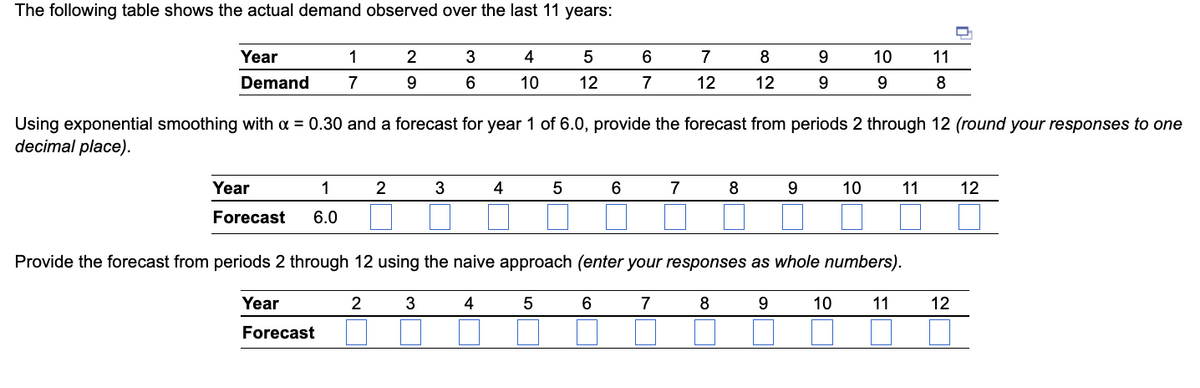
The following table shows the actual demand observed over the last 11 years:
|
Year |
1 |
2 |
3 |
4 |
5 |
6 |
7 |
8 |
9 |
10 |
11 |
|
Demand |
7 |
9 |
6 |
10 |
12 |
7 |
12 |
12 |
9 |
9 |
8 |
Part 2
Using exponential smoothing with
α =
0.30 and a
6.0, provide the forecast from periods 2 through 12 (round your responses to one decimal place).
|
|
|
|
|
|
|
|
|
|
|
|
|
|
|
|
|
|
|
|
|
|
|
|
|
|
|
|
Part 3
Provide the forecast from periods 2 through 12 using the naive approach (enter your responses as whole numbers).
|
|
|
|
|
|
|
|
|
|
|
|
|
|
|
|
|
|
|
|
|
|
|
|
|
|
Transcribed Image Text:The following table shows the actual demand observed over the last 11 years:
Year
Demand
Year
1
Forecast 6.0
1
7
Year
Forecast
2
9
2
3
6
3
4
10
4
5
12
5
Using exponential smoothing with α = 0.30 and a forecast for year 1 of 6.0, provide the forecast from periods 2 through 12 (round your responses to one
decimal place).
6
7
6
7
12
7
8
12
8
9
9
9
10
9
10
10
Provide the forecast from periods 2 through 12 using the naive approach (enter your responses as whole numbers).
2 3
4
5
6 7 8
9
11
11
11
8
12
12
Expert Solution
This question has been solved!
Explore an expertly crafted, step-by-step solution for a thorough understanding of key concepts.

This is a popular solution!

Trending now
This is a popular solution!

Step by step
Solved in 3 steps with 6 images

Recommended textbooks for you
Practical Management Science
Operations Management
ISBN:
9781337406659
Author:
WINSTON, Wayne L.
Publisher:
Cengage,

Contemporary Marketing
Marketing
ISBN:
9780357033777
Author:
Louis E. Boone, David L. Kurtz
Publisher:
Cengage Learning

Purchasing and Supply Chain Management
Operations Management
ISBN:
9781285869681
Author:
Robert M. Monczka, Robert B. Handfield, Larry C. Giunipero, James L. Patterson
Publisher:
Cengage Learning
Practical Management Science
Operations Management
ISBN:
9781337406659
Author:
WINSTON, Wayne L.
Publisher:
Cengage,
Contemporary Marketing
Marketing
ISBN:
9780357033777
Author:
Louis E. Boone, David L. Kurtz
Publisher:
Cengage Learning
Purchasing and Supply Chain Management
Operations Management
ISBN:
9781285869681
Author:
Robert M. Monczka, Robert B. Handfield, Larry C. Giunipero, James L. Patterson
Publisher:
Cengage Learning
