The following table shows the actual demand observed over the last 11 years: Year 1 2 3 4 5 6 7 8 9 10 11 Demand 7 9 5 10 13 7 11 13 8 13 8 Using exponential smoothing with x = 0.40 and a forecast for year 1 of 6.0, provide the forecast from periods 2 through 12 (round your responses to one decimal place). Year 1 2 3 4 5 6 7 8 9 10 11 12 Forecast 6.0 Provide the forecast from periods 2 through 12 using the naive approach (enter your responses as whole numbers). Year 2 3 4 5 6 7 8 9 10 11 12 Forecast
The following table shows the actual demand observed over the last 11 years: Year 1 2 3 4 5 6 7 8 9 10 11 Demand 7 9 5 10 13 7 11 13 8 13 8 Using exponential smoothing with x = 0.40 and a forecast for year 1 of 6.0, provide the forecast from periods 2 through 12 (round your responses to one decimal place). Year 1 2 3 4 5 6 7 8 9 10 11 12 Forecast 6.0 Provide the forecast from periods 2 through 12 using the naive approach (enter your responses as whole numbers). Year 2 3 4 5 6 7 8 9 10 11 12 Forecast

Linear Algebra: A Modern Introduction
4th Edition
ISBN:9781285463247
Author:David Poole
Publisher:David Poole
Chapter7: Distance And Approximation
Section7.3: Least Squares Approximation
Problem 33EQ

Related questions
Question
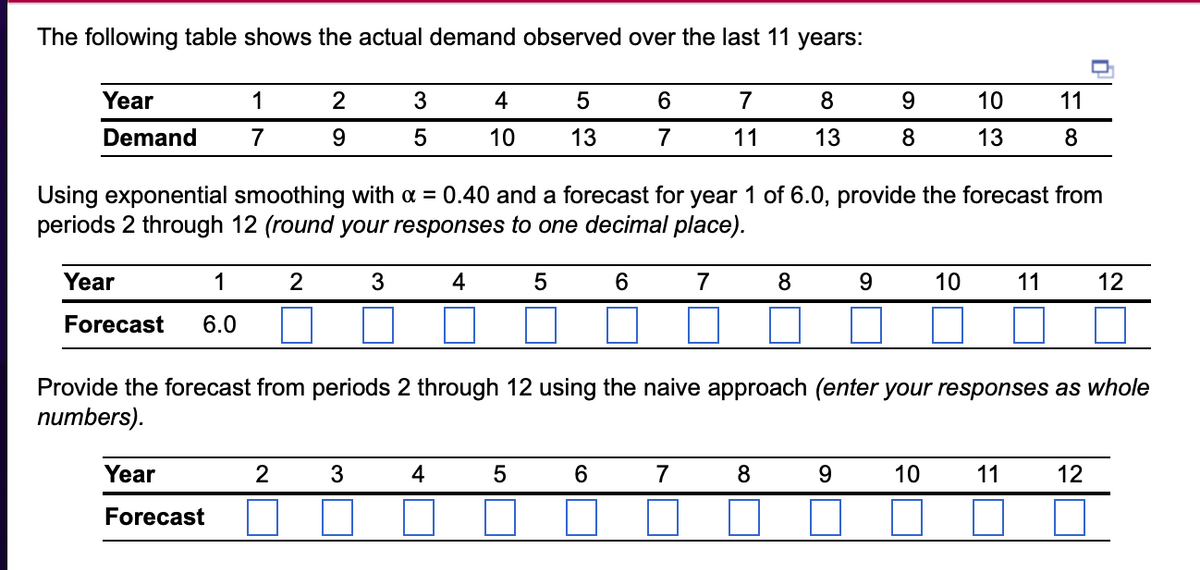
Transcribed Image Text:The following table shows the actual demand observed over the last 11 years:
Year
1
2
3
4
5
6
7
8
9
10
11
Demand
7
9
5
10
13
7
11 13
8
13
8
Using exponential smoothing with α = 0.40 and a forecast for year 1 of 6.0, provide the forecast from
periods 2 through 12 (round your responses to one decimal place).
Year
1
2
3
4
5
6
7
8
9
10
11
12
Forecast 6.0
Provide the forecast from periods 2 through 12 using the naive approach (enter your responses as whole
numbers).
Year
2
3
4
5
6
7
8
9
10
11
12
Forecast
Expert Solution
This question has been solved!
Explore an expertly crafted, step-by-step solution for a thorough understanding of key concepts.

This is a popular solution!

Trending now
This is a popular solution!

Step by step
Solved in 3 steps

Recommended textbooks for you
Linear Algebra: A Modern Introduction
Algebra
ISBN:
9781285463247
Author:
David Poole
Publisher:
Cengage Learning


Algebra & Trigonometry with Analytic Geometry
Algebra
ISBN:
9781133382119
Author:
Swokowski
Publisher:
Cengage
Linear Algebra: A Modern Introduction
Algebra
ISBN:
9781285463247
Author:
David Poole
Publisher:
Cengage Learning
Algebra & Trigonometry with Analytic Geometry
Algebra
ISBN:
9781133382119
Author:
Swokowski
Publisher:
Cengage