The following table shows the daily receipts in millions of dollars of the movie "The Hu March 2012. Days $Receipts 152.535 14 33.111 28 14.666 42 5.587 56 2.95 70 1.567 84 0.852


Q: The following chart shows monthly figures for Apple stock in 2010. 350 317.13 300 - 317.44 294 07…
A: Solution: The formula you are using in class is for Compound interest rate but in the question it is…
Q: The ages of the students in a statistics class are listed below. If the 18 year old student has a…
A: Given Information: Ages: 14, 15, 15, 16, 16, 16, 16, 17, 17, 17, 17, 17, 18
Q: wing data are the yields, in bushels, of hay from a farmer's last 10 years: 375, 210, 150, 147, 429,…
A: Data: The first quartile is located between the values in positions 2 and 3. Those values, based…
Q: The accompanying table gives the population (in hundred thousands) and number of people not covered…
A:
Q: find 30th percentile for data 10,15,16,18,19,21,23,25,26,28,32,35,36,39,42,45,46,50
A: Given 10,15,16,18,19,21,23,25,26,28,32,35,36,39,42,45,46,50
Q: Consumer price index (2016-17=100) 100 238.132 Year Miss Safaludin's monthly salary (RM) 600 7000…
A:
Q: The most obese countries in the world have obesity rates that range from 11.4% to 2. 74.6%. This…
A: Solution: Consider the given data. Let f : Number of countries for each class of percent Find the…
Q: Find the Fan Cost Index for the Pittsburgh Steelers. Team Ticket Other Drink Soft Drink Hot Dog…
A: Team Pittsburgh Steelers Ticket $100.64 Other Drink $8.00 Soft Drink…
Q: The following data represents earnings per share for 38 US companies operating globally. 81, 58, 84,…
A: The data on earnings per share for 38 US companies operating globally (x) is given by: 81, 58, 84,…
Q: Listed below is the Fan Cost Index of the NBA for a given year. Find the percent of increase of the…
A: To find the percent of increase first calculate the increase in FCI 339.02-315.66 =23.36 Now…
Q: An analyst might want to determine whether there is a difference in the cost per mile of airfares in…
A: Given: City 1979 (x1) 2009 (x2) 1 20.3 22.8 2 19.5 12.7 3 18.6 14.1 4 20.9 16.1 5 19.9…
Q: The follow table shows total dollar sales (in thousands) for a local retailer for various years.…
A: The table shows total dollars sales for a local retailer for the various years is, Year 2015…
Q: The following data is based on the monthly fees paid by 50 internet users in the year 2000. 8,…
A: DATA 8 9 10 10 12 13 14 15 15 15 15 18 18 19 19 20 20 20 20…
Q: The following data gives the highest points scored by a player in a given year from 2000 to 2009:…
A: mode: mode is the most frequently repeatedvalue in the given data set.
Q: The data below shows the salaries, in thousands of dollars, of employees at the same business.…
A: Sampling is a way of selecting data from a population.
Q: The following chart shows monthly figures for Apple stock in 2010.t 350 317.13 300 - 317,44 294.07…
A:
Q: Thirteen students entered the undergraduate business program at Rollins College 2 years ago. The…
A: The slope and intercept of the regression line can be obtained using excel steps as follow: Enter…
Q: The following list shows the selling prices of 8 houses in a certain House Price House Price A…
A: In statistics, three measures of central tendency are widely used. These three measures are also…
Q: The following data give the percentage of men working in five in the retail and trade industries.…
A: Use the Excel and Perform the Regression. Followings are the Steps to perform the Regression 1) Open…
Q: What is the mode of the data: 21, 38, 12, 19, 38, 30, 19, 38, 12, 22, 31, 12, 38, 18, 27, 38, 12. 39…
A: Use the definition of mode. The mode of a data set is the number that occurs most frequently in the…
Q: The following data correspond to the times in minutes between 6 calls for an ambulance in Mexico…
A: Solution : Given : n= 6 x = 27, 15, 20, 32, 18, 26 μ = 20 Let , α = 0.05…
Q: what are the three categories of business analytics
A: Given problem Given that
Q: The following data are the distances between 50 retail stores and a large distribution center. The…
A: Given data is ; 106 , 108 , 113 , 118 , 119 , 126 , 130 , 134 , 141 , 144 , 145 , 147 , 151 ,…
Q: The following data gives the highest points scored by a player in a given year from 2000 to 2009:…
A: Given Data 49,63,47,45,58,67,51,57,67,64
Q: The following data are the distances between 50 retail stores and a large distribution center. The…
A: An outlier is an observation that lies abnormally from other values in a random sample from a…
Q: Here are the number of hours that each of a group of students studied for this exam: 2 4 22 2 1 4 1…
A: Number of samples (n) = 10 Let "X" be the number of hours that each of a group of students studied…
Q: I have the final exam scores of a Stats class, they are: 85, 82, 81, 83, 89, 96, 70, 71, 52, 30,…
A: The provided data set is: 85 82 81 83 89 96 70 71 52 30…
Q: The following table shows the total spent on research and development by industry in a country, in…
A: Here you've given that two variables named as Year and Spending ($ billions). Let us define the…
Q: A CBS News poll conducted June 10 and 11, 2006, among a nationwide random sample of 651 adults,…
A:
Q: 4. Describe the correlation between hours worked at a job and the money earned.
A: To write the correlation between hours worked at a job and the money earned
Q: A CBS News poll conducted June 10 and 11, 2006, among a nationwide random sample of 651 adults,…
A: From the given information, better same worse Total Republican 38 104 44…
Q: The following table shows the systolic blood pressure of 5 women and 5 men. Women 110 120 95…
A: We state the hypothesis for testing difference in means. H0: There is no significant difference…
Q: Suppose that the cumulative relative frequency table below shows the data on female life expectancy…
A: The median is the middle most value of the observations.
Q: CBS News poll conducted June 10 and 11, 2006, among a nationwide random sample of 651 adults, asked…
A:
Q: he is considering. In the table below, what is the 2017 value for the Salary Index of Job 2? Base…
A:
Q: The data below is from https://www.worldometers.info/world-population/mexico-population/ Year…
A: 1)Given data of Year and respective population in Mexico as shown below The scatter plot of the data…
Q: According to the U.S. Census Bureau, the average household income was $73,298 in 2014 (the latest…
A: Median is kind of average that divides the total data distribution in two equal parts.
Q: Which of the following sets of data represent valid functions? OG = {(– 5, – 1), (3, 2), (6, 4), (9,…
A: Function is defined as for any given input there is exactly one output.
Q: Most Expensive Colleges Listed below are the annual costs (dollars) of tuition and fees at the 10…
A: In this case, we need to find the mean, median, mode and midrange for the given data.The formula for…
Q: Here is a set of data. 11 199 208 352 418 628 788 792 821 937 946 972 Identify the 5 number…
A: From the given data, the minimum and maximum values are 11 and 972 respectively.
Q: The following list shows the heights in inches of the players on the opening-night roster of the…
A: Given some heights in inches of the players. We need to find the standard deviation. Let's begin.
Q: find out mean for given data 78,89,65,2,36,78,96,85,87,21,65,986,20.36,65,42,3
A:
Q: The following table shows the square footage of houses in an area that sold recently along with the…
A: 1. Find the equation of the regression line (line of best fit).
Q: The table below shows the number of cars (in millions) sold in the United States for various years…
A:
Q: Please, find the Median of the given data. ASAP Monthly rent less than (Rs.) 10 20 30 40 50…
A:
Q: find mean for given data 12,15,14,6,9,7,5,3,4,15,25,35,6,45,75,35,20,35
A:
Q: Suppose a statistics professor reports a final exam average
A: Empirical rules tell us about how much percentage of data falls within the intervals. According to…
Q: The following data represent the number of people aged 25 to 64 years covered by health insurance…
A: From the provided information, Age 25-34 35-44 45-54 55-64 Number (millions) 20.1…
Q: Find the mean of the following data. 16, 19, 17, 13, 22, 20, 14, 15 None of these 19 25 17
A: According to our terms and conditions I have solved first question for next question repost
Q: Which equation best represents the line? y = - x + 1150? y = - x + 1250? y = - 8x + 1150? y = - 8x +…
A:
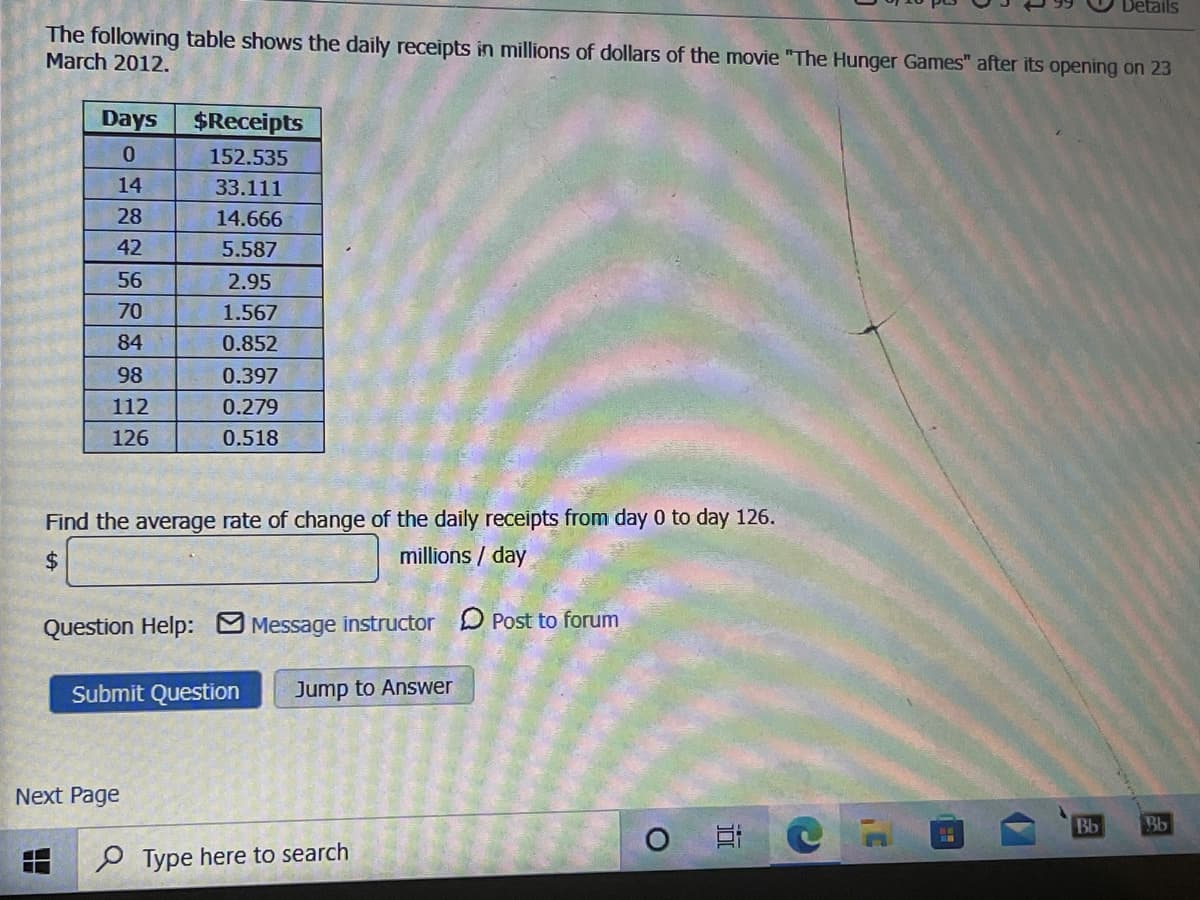
We are asked to find the rate of change.

Trending now
This is a popular solution!

Step by step
Solved in 2 steps

- The US. import of wine (in hectoliters) for several years is given in Table 5. Determine whether the trend appearslinear. Ifso, and assuming the trend continues, in what year will imports exceed 12,000 hectoliters?The following table shows the daily receipts in millions of dollars of the movie "The Hunger Games" after its opening on 23 March 2012. Days $Receipts 0 152.535 14 33.111 28 14.666 42 5.587 56 2.95 70 1.567 84 0.852 98 0.397 112 0.279 126 0.518 Estimate the instantaneous rate of change of the daily receipts on day 70.The following table shows timber stumpage prices for pine pulpwood in two regions of the American South. Prices are in dollars per ton and were recorded at the start of the indicated year. Year Region 1 Region 2 2002 6.30 4.00 2005 7.50 6.70 2007 7.00 9.00 (a) For Region 2, what is the average rate of change per year in price from 2002 to 2005?(b) Use your answer to part (a) to estimate the price in Region 2 at the start of 2004. (The actual price was $6.40 per ton.)(c) For Region 1, what is the average rate of change per year in price from 2005 to 2007?(d) Use your answer to part (c) to estimate the price in Region 1 at the start of 2008.(e) For each region, find the percentage increase in price from 2002 to 2007. (Round your answers to one decimal place.) Region 1 % Region 2 % (f) On the basis of your answer to part (e), in the absence of other factors, would an investor in timber be better advised to choose Region 1 or Region 2? Region 1Region 2
- Over the past 14 months,the monthly percentages of all shipments received on time are Monthy Proportion of On Tme Shipments 72 81 78 90 83 85 90 82 89 81 85 84 78 88 What is MSE using exponential smoothing forecast for α=0.3? (keep 2 decimal points)According to a high-profile realtor, houses in the sleepy town of Sun Beach have shown higher appreciation over the past three years than have houses in the bustling town of North Arden. To test the realtor's claim, an economist has found eight recently sold homes in Sun Beach and eight recently sold homes in North Arden that were owned for exactly three years. The following table gives the appreciation (expressed as a percentage increase) for each of the sixteen houses. Appreciation rates in percent Sun Beach 10.2, 9.7, 12, 10.4, 7.9, 10.9, 9.6, 13.3 North Arden 7.5, 12.8, 5.9, 8.5, 8.1, 9.3, 6.3, 13.4 Assume that the two populations of appreciation rates are normally distributed and that the population variances are equal. Can we conclude, at the 0.05 level of significance, that houses in Sun Beach have higher appreciation over the past three years than houses in North Arden? Perform a one-tailed test. The null hypothesis: H0:…The table below shows the number of cars (in millions) sold in the United States forvarious years and the percent of those cars manufactured by GM.
- This table describes the departure of flights out of an airport for the months of April and May. What percentage of the flights in May were delayed? Give your answer to one decimal placeRakeem is researching a population of fruit flies. He observes the number of fruit flies present every other day for one week and records the data in the table shown. 1 20 3 400 5 8000 7 160000 What is the average rate of change in the number of fruit flies present between Day 3 and Day 5?You improve your time running a course by 5 Seconds in week one by three seconds in week 2 and by 4 seconds and week 3 what is the average weekly change in your running time
- The following Table shows the distribution of daily profits made by a local supermarket over a 30-day period. I need help with this tableThe following table shows the daily receipts in millions of dollars of the movie "The Hunger Games" after its opening on 23 March 2012. Find the average rate of change of the daily receipts from day 21 to day 105.What is the predicted percentage of people without health insurance in 2020? Round your result to two decimal places.