The following table shows the monthly demand and supply in the market for shoes in New York City. Price Quantity Demanded Quantity Supplied (Dollars per pair of shoes) (Pairs of shoes) (Pairs of shoes) 20 1,100 200 40 900 400 60 800 500 80 600 900 100 500 1,200 On the following graph, plot the demand for shoes using the blue point (circle symbol). Next, plot the supply of shoes using the orange point (square symbol). Finally, use the black point (plus symbol) to indicate the equilibrium price and quantity in the market for shoes. Note: Plot your points in the order in which you would like them connected. Line segments will connect the points automatically.
The following table shows the monthly demand and supply in the market for shoes in New York City. Price Quantity Demanded Quantity Supplied (Dollars per pair of shoes) (Pairs of shoes) (Pairs of shoes) 20 1,100 200 40 900 400 60 800 500 80 600 900 100 500 1,200 On the following graph, plot the demand for shoes using the blue point (circle symbol). Next, plot the supply of shoes using the orange point (square symbol). Finally, use the black point (plus symbol) to indicate the equilibrium price and quantity in the market for shoes. Note: Plot your points in the order in which you would like them connected. Line segments will connect the points automatically.

Chapter3: Supply And Demand: Theory
Section: Chapter Questions
Problem 8WNG

Related questions
Question
10. Market equilibrium
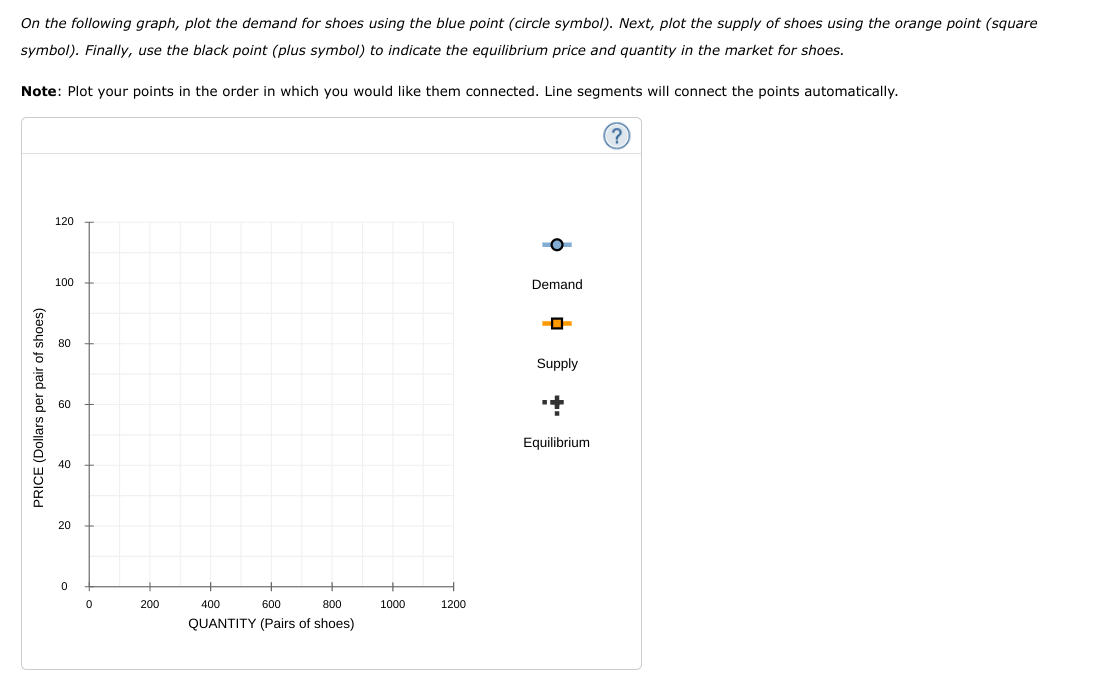
The following table shows the monthly demand and supply in the market for shoes in New York City.
|
Price
|
Quantity Demanded
|
Quantity Supplied
|
|---|---|---|
|
(Dollars per pair of shoes)
|
(Pairs of shoes)
|
(Pairs of shoes)
|
| 20 | 1,100 | 200 |
| 40 | 900 | 400 |
| 60 | 800 | 500 |
| 80 | 600 | 900 |
| 100 | 500 | 1,200 |
On the following graph, plot the demand for shoes using the blue point (circle symbol). Next, plot the supply of shoes using the orange point (square symbol). Finally, use the black point (plus symbol) to indicate the equilibrium price and quantity in the market for shoes.
Note: Plot your points in the order in which you would like them connected. Line segments will connect the points automatically.
Transcribed Image Text:On the following graph, plot the demand for shoes using the blue point (circle symbol). Next, plot the supply of shoes using the orange point (square
symbol). Finally, use the black point (plus symbol) to indicate the equilibrium price and quantity in the market for shoes.
Note: Plot your points in the order in which you would like them connected. Line segments will connect the points automatically.
120
100
Demand
80
Supply
60
Equilibrium
200
400
600
800
1000
1200
QUANTITY (Pairs of shoes)
PRICE (Dollars per pair of shoes)
Expert Solution
This question has been solved!
Explore an expertly crafted, step-by-step solution for a thorough understanding of key concepts.

This is a popular solution!

Trending now
This is a popular solution!

Step by step
Solved in 2 steps with 1 images

Knowledge Booster


Learn more about
Need a deep-dive on the concept behind this application? Look no further. Learn more about this topic, economics and related others by exploring similar questions and additional content below.Recommended textbooks for you


Economics (MindTap Course List)
Economics
ISBN:
9781337617383
Author:
Roger A. Arnold
Publisher:
Cengage Learning
Economics (MindTap Course List)
Economics
ISBN:
9781337617383
Author:
Roger A. Arnold
Publisher:
Cengage Learning


Exploring Economics
Economics
ISBN:
9781544336329
Author:
Robert L. Sexton
Publisher:
SAGE Publications, Inc