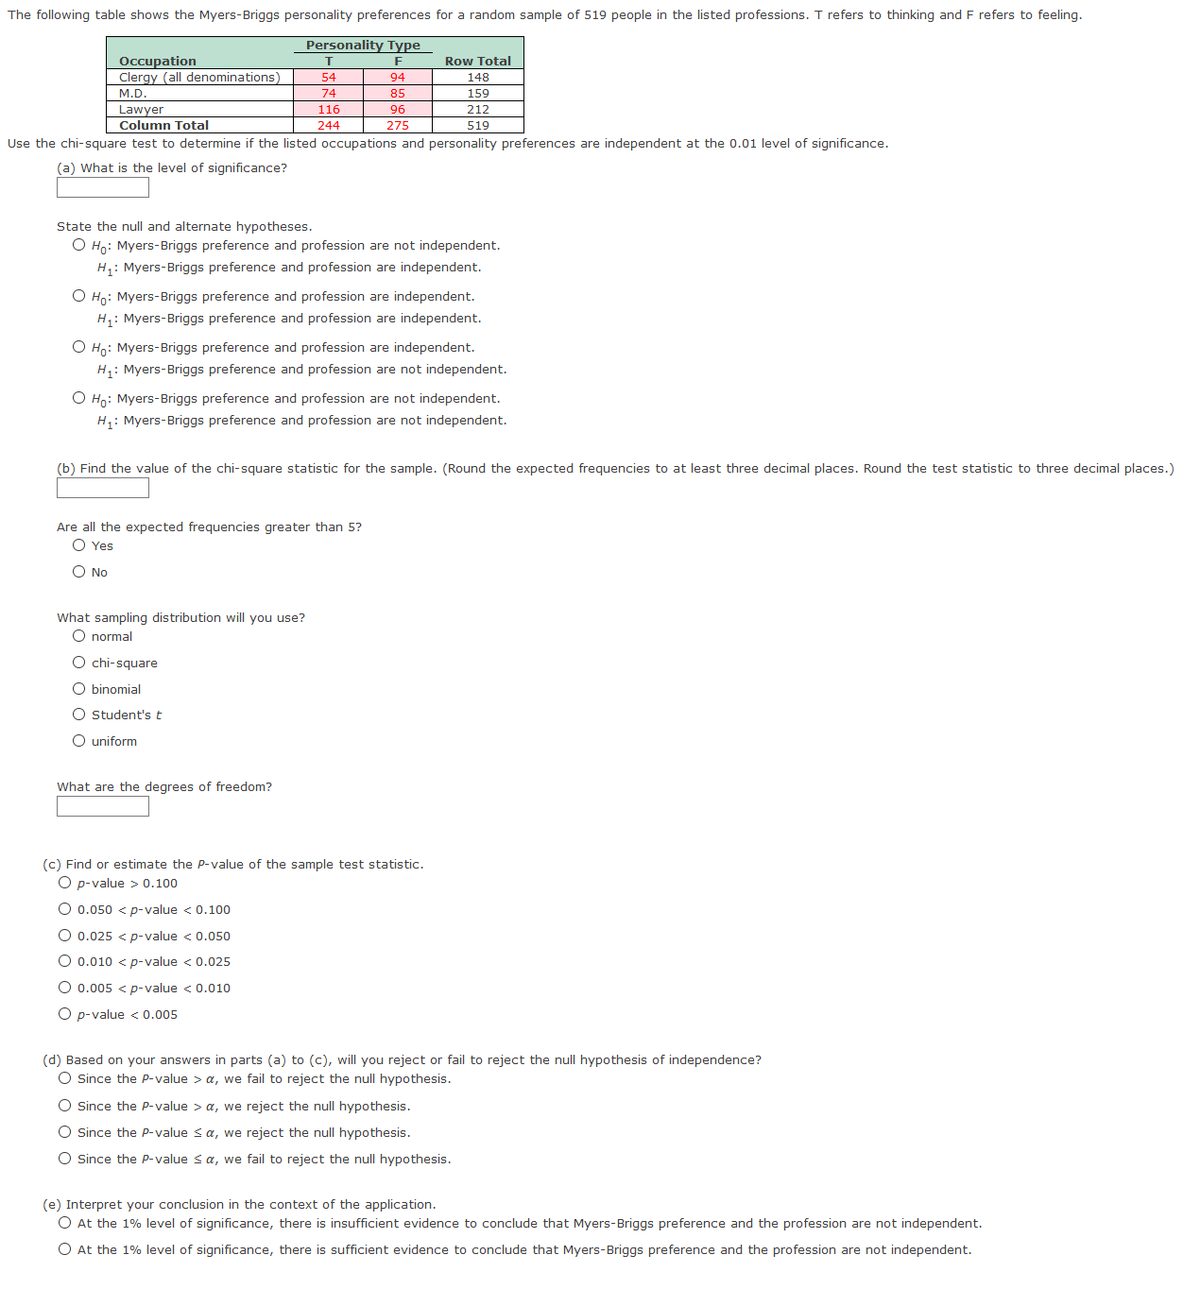
The following table shows the Myers-Briggs personality preferences for a random sample of 519 people in the listed professions. T refers to thinking and F refers to feeling.
The following table shows the Myers-Briggs personality preferences for a random sample of 519 people in the listed professions. T refers to thinking and F refers to feeling.

Holt Mcdougal Larson Pre-algebra: Student Edition 2012
1st Edition
ISBN:9780547587776
Author:HOLT MCDOUGAL
Publisher:HOLT MCDOUGAL
Chapter11: Data Analysis And Probability
Section: Chapter Questions
Problem 8CR

Related questions
Question
The following table shows the Myers-Briggs personality preferences for a random sample of 519 people in the listed professions. T refers to thinking and F refers to feeling.
Transcribed Image Text:The following table shows the Myers-Briggs personality preferences for a random sample of 519 people in the listed professions. T refers to thinking and F refers to feeling.
Personality Type
Occupation
Clergy (all denominations)
F
Row Total
54
94
148
M.D.
74
85
159
Lawyer
116
96
212
Column Total
244
275
519
Use the chi-square test to determine if the listed occupations and personality preferences are independent at the 0.01 level of significance.
(a) What is the level of significance?
State the null and alternate hypotheses.
O Ho: Myers-Briggs preference and profession are not independent.
H,: Myers-Briggs preference and profession are independent.
O Ho: Myers-Briggs preference and profession are independent.
H,: Myers-Briggs preference and profession are independent.
O Ho: Myers-Briggs preference and profession are independent.
H: Myers-Briggs preference and profession are not independent.
O Ho: Myers-Briggs preference and profession are not independent.
H: Myers-Briggs preference and profession are not independent.
(b) Find the value of the chi-square statistic for the sample. (Round the expected frequencies to at least three decimal places. Round the test statistic to three decimal places.)
Are all the expected frequencies greater than 5?
O Yes
O No
What sampling distribution will you use?
O normal
O chi-square
O binomial
O Student's t
O uniform
What are the degrees of freedom?
(c) Find or estimate the P-value of the sample test statistic.
O p-value > 0.100
O 0.050 < p-value < 0.100
O 0.025 < p-value < 0.050
O 0.010 < p-value < 0.025
O 0.005 < p-value < 0.010
O p-value < 0.005
(d) Based on your answers in parts (a) to (c), will you reject or fail to reject the null hypothesis of independence?
O Since the P-value > a, we fail to reject the null hypothesis.
O since the P-value > a, we reject the null hypothesis.
O Since the P-value sa, we reject the null hypothesis.
O Since the P-value s a, we fail to reject the null hypothesis.
(e) Interpret your conclusion in the context of the application.
O At the 1% level of significance, there is insufficient evidence to conclude that Myers-Briggs preference and the profession are not independent.
O At the 1% level of significance, there is sufficient evidence to conclude that Myers-Briggs preference and the profession are not independent.
Expert Solution
This question has been solved!
Explore an expertly crafted, step-by-step solution for a thorough understanding of key concepts.

This is a popular solution!

Trending now
This is a popular solution!

Step by step
Solved in 4 steps

Knowledge Booster


Learn more about
Need a deep-dive on the concept behind this application? Look no further. Learn more about this topic, statistics and related others by exploring similar questions and additional content below.Recommended textbooks for you
Holt Mcdougal Larson Pre-algebra: Student Edition…
Algebra
ISBN:
9780547587776
Author:
HOLT MCDOUGAL
Publisher:
HOLT MCDOUGAL
Holt Mcdougal Larson Pre-algebra: Student Edition…
Algebra
ISBN:
9780547587776
Author:
HOLT MCDOUGAL
Publisher:
HOLT MCDOUGAL