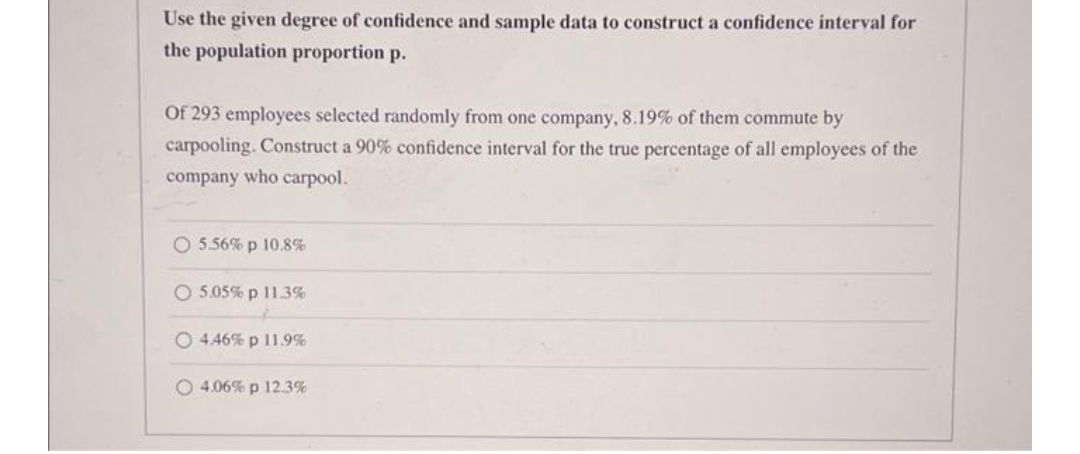
Use the given degree of confidence and sample data to construct a confidence interval for the population proportion p.


Q: An engineer is going to redesign an ejection seat for an airplane. The seat was designed for pilots ...
A: We have given that. X~N( μ , ?^2 ) μ =139 , ? =26.7 ,n=37 Z-score =( x - μ )/?
Q: SUMMARY OUTPUT Regression Statistics Multiple R R Square Adjusted R Square Standard Error 0.953 Obse...
A: Here the total number of observations = n = 20 Response variable : y : Teacher's salary Predictor va...
Q: A new sneaker claims that it can make male athletes jump higher. A sample of 36 male athletes were a...
A: It is known that, Sample size is n= 36 Mean = 2 inches. And sample standard deviation, s= 1.3
Q: An experiment consists of asking 3 women at random if they wash their dishes with brand X detergent....
A:
Q: We are estimating a population mean, using a sample of size n. Determine the upper-tail critical val...
A: Given (1) 1-ɑ=0.90, n=30 (2) 1-ɑ=0.99, n=24 (3) 1-ɑ=0.90, n=8 Note: According to Bartleby guide...
Q: For the same level of type I error, in order to decrease the probability of type II error we can, In...
A:
Q: The following table shows the amount spent by four U.S. airlines to fly one available seat 1 mile in...
A:
Q: Consider the Inverse-CDF method for generating Exponential random variables. Use the Uni((0, 1)) ind...
A: Given: λ=0.5 X ~ Exp (0.5) The values of uniform distribution is as shown below 0.41 0.25 0....
Q: Measuring and weighing patients while wearing shoes. Which of the following causes variations chara...
A: Measuring and weighing patients while wearing shoes. Random error causes variations characterizes t...
Q: Thousands of Persons nd ter Third Fourth Annual Quarter Quarter Visitors 1,047.3 939.5 3,934.5 1,042...
A: *Answer: Given details: Find the Given details for Seasonal and trend factors: Given details: ...
Q: Calculate the arithmetic mean from the following
A: The arithmetic mean is calculated as Mean = ∑f.x/∑f Where is x is mid-point.
Q: Researchers were interested in whether the mean number of words recalled from short term memory dif...
A: In order to determine whether the mean number of words recalled from short term memory differ based ...
Q: attend physical fitness sessions? - The average weight of 1,000 3-year-old female toddlers from a ce...
A: 2) We have given that. X~N( μ , ?^2 ) μ =14 , ? =2 Z-score =( x - μ )/?
Q: a. If PO1 Dela Cruz's waist girth is 32, how many standard deviations away is he from the mean? b. W...
A: Since you have asked multiple questions, we will solve the first question for you. If you want any s...
Q: 1. We use F - distribution to test the equality of several population means. 2. In ANOVA; if we te...
A: INTRODUCTION: F distribution: The Test statistic used in the testing of the hypothesis using F dis...
Q: In Alberta, a 9-1-1 dispatch center receives an average of 3.763 calls per day (that is, per a given...
A:
Q: P(-2.8 < z < -1.45)
A: Here normal distribution
Q: Lightbulbs: The lifetime of lightbulbs has a mean of 1500 hours and a standard deviation of 100 hour...
A:
Q: Example 20. Given the following values Year Series A Year Series B E Po9 = Rs. 20 EP,9 = Rs. 24 1994...
A:
Q: 3) The following two sets of Excel output use are from the same data set as described above, but the...
A: Given that, The first set of output is for the set of 35 CEOs that earn the lowest total compensati...
Q: What is the relationship of population, sampling, sample, and inference in statistics?
A: Statistics is a field of study which involves collecting, arranging, analyzing and drawing inference...
Q: Suppose that about 82% of graduating students attend their graduation. A group of 22 students is ran...
A:
Q: _1. A restaurant gives free pasta for every 10th customer in celebration of their 10th year annivers...
A: 8.An engineer selects every 50th cellphone from the assembly line for careful testing and analysis.
Q: Variety 1 2 3 4 5 6 A 35.3 31.0 32.7 36.8 37.2 33.1 B 30.7 32.2 31.4 31.7 35.0 32.7 C 38.2 33.4 33.6...
A: Obtain the value of test statistic F value for the treatment. Use EXCEL Procedure to obtain the va...
Q: Accident data were analyzed to determine the numbers of fatal accidents for automobiles of three siz...
A: Given: Small medium large Fatal 67 26 16 Non Fatal 128 63 46
Q: What is probability and why would one want to find the probability of an event that has not occurred...
A: We have to define Probability and why would one want to find the probability of an event that has n...
Q: A survey was conducted to investigate the interest of middle-aged adults in physical fitness program...
A: An appropriate hypothesis is to be set up for the population level, that would be tested for the cla...
Q: the t-distribution table shows a value of 1.72 for error of 0.05 and 22 degrees of freedom. We have ...
A:
Q: For the frequency table shown below, answer the following questions. 1.What is the median of the dat...
A: Given data : 0,0,0,0,0,1,1,1,1,1,1,1,1,1,2,2,2,2,3,3,4,4,4
Q: The Pie charts can be used to visualize 1. Only 1 variable; 2. Not more than 10 variables; 3. Only v...
A: The pie charts can be used to visualize Select the correct choice
Q: Consider the negative binomial distribution with parameters r and ß has probabilities (k+ Pr(N = k) ...
A:
Q: A particular fruit's weights are normally distributed, with a mean of 322 grams and a standard devia...
A:
Q: 16) Determine the Interquartile Range of the set of data. Show all work. nti 17) Determine if there ...
A: We know that Interquartile range = IQR IQR= Q3 - Q1
Q: Data is collected on teacher salary (measured in 1000’s of $’s) and years of service, rating by the ...
A: Given Data is collected on teacher salary (measured in 1000’s of $’s) and years of service, rating b...
Q: a) What is the annual net level premium for a $100,000 fully discrete life insurance (only) 10-year ...
A: Given i=0.05 Mortality : The Standard Ultimate Life table
Q: 5.37 Dental anxiety study. To gauge their fear of going to a den- tist, a random sample of adults co...
A:
Q: * If HO: u=30 HA: µ #30 O HA: μ 30 Ο all above O dont of them O
A: Given Null hypothesis Ho: μ=30
Q: Jim kept track of how many people attended each Syracuse basketball game last season. How should he...
A: Quantitative data: The data which can be expressed as numerically is called quantitative data. Categ...
Q: What is the standard deviation for Stock B? Use a whole number in percent form, no space, no commas,...
A: Standard deviation is the measure of dispersion. It helps to understand the deviation of observation...
Q: : Find Karl Pearson's coefficient of correlation between the values of X and Y given below and calcu...
A:
Q: will give 100% rating thumbs up if answered all!! A box contain 5 green, 7 yellow, and 10 orange pi...
A: Given,no.of green balls=5no.of yellow balls=7no.of orange balls=10Total no.of balls =22
Q: 3 Question Samples according the object selection method can be divided to : 1. Random and non rando...
A: Given problem Given that Samples according the object selection method can be divided to : Ans) ...
Q: A pediatrician had 10 patients on a particular clinic day. The weights of her patients on that day a...
A: The formula of the variance is,
Q: II. For each of the following variables, indicate whether it is qualitative or quantitative variable...
A: Quantitative data: Data that can be counted or measured, and given a numerical value. Qualitative da...
Q: 5.47 Ambulance response time. Ambulance response time is measured as the time (in minutes) between t...
A:
Q: 1 dx +x, Vx
A:
Q: Use the OCumulative Normal Distribution Table to find the z-score for which the area to its right is...
A:
Q: Calculate Pearson's Coefficient of Skewness from the table given below : Life Time (Hours) No. of Tu...
A: Skewness measure the spread of the data. There are three types of skewness, they are positive skew, ...
Q: A refrigerator manufacturer claims that the mean life of its competitor's refrigerators is less ...
A:
Q: * If the CV of A ==11.18% , CV of B= 14.09
A: It is given that Coefficient of variation of A = 11.18% Coefficient of variation of B = 14.09%


Trending now
This is a popular solution!

Step by step
Solved in 3 steps with 2 images

- After Texas A&M lost again to their rival, the University of Texas, in a football game, the A&M Alumni association decided to conduct a survey to see who wanted to fire the head football coach. Let p represent the proportion of all alumni who favor firing the coach. To guarantee an estimate that is within 0.05 of p at the 95% confidence level, which of the following is the smallest sample size needed? a 269 b 1436 c 385 d 601 e 421Use the given degree of confidence and sample data to construct a confidence interval for the population proportion p. Of 92 adults selected randomly from one town, 61 have health insurance. Find a 90% confidence interval for the true proportion of all adults in the town who have health insurance. A) 0.548 < p < 0.778 B) 0.536 < p < 0.790 C) 0.582 < p < 0.744 D) 0.566 < p < 0.760Use the given degree of confidence and sample data to construct a confidence interval for the population proportion p. Round to three decimal palces. Of 86 adults selected randomly from one town, 70 have health insurance. Find a 90% confidence interval for the true proportion of all adults in the town who have health insurance. A. 0.745<p<0.883 B. 0.716<p<0.912 C. 0.732<p<0.896 D. 0.706<p<0.922
- An epidemiologist is worried about the prevalence of the flu in East Vancouver and the potential shortage of vaccines for the area. She will need to provide a recommendation for how to allocate the vaccines appropriately across the city. She takes a simple random sample of 339 people living in East Vancouver and finds that 40 have recently had the flu. For each of the following statements, specify whether the statement is a correct interpretation of the 95% confidence interval for the true proportion of East Vancouver residents who have recently had the flu. A. 11.80% (40/339) of East Vancouver residents have recently had the flu. ? true false B. There is a 95% probability that the true proportion of East Vancouver residents who have recently had the flu equals 40/339. ? true false C. If another random sample of 339 East Vancouver residents is drawn, there is a 95% probability that the sample proportion of East Vancouver residents who have recently had the flu equals 40/339. ?…The owner of the AGT Gas Station wishes to determine the fraction of customers who pay using a credit card or debit card. A random sample of 100 customers was surveyed and finds that 80 paid using their credit card or debit card. If you are going to construct a 99% confidence interval for the fraction of customers who paid using their credit card or debit card, what will be the value of the margin of error? a. 0.0658 b. 0.103 c. 0.0784 d. 0.0299A recent survey of cell phone users indicated that 56 percent of the respondents prefer to use cell phones for texting rather than for making phone calls. A 95 percent confidence interval for the estimate of all cell phone users who prefer to use cell phones for texting has a margin of error of 3 percent. Assume all conditions for inference have been met. Based on the confidence interval, which of the following claims is supported? Select A, B, C, or D Less than half of all people prefer texting. A More than half of all people prefer texting. B At least 60 percent of all people prefer texting. C At least 75 percent of all people prefer texting. D At least 95 percent of all people prefer texting. E
- Refer to the accompanying data set of 20 randomly selected presidents. Treat the data as a sample and find the proportion of presidents who were taller than their opponents. Use that result to construct a 95% confidence interval estimate of the population percentage. Based on the result, does it appear that greater height is an advantage for presidential candidates? Why or why not? Construct a 95% confidence interval estimate of the percentage of presidents who were taller than their opponents. PRESIDENT HEIGHT HEIGHT OPPMcKinley 170 178Lincoln 193 188Reagan 185 177Taft 182 178Harrison 173 168Van Buren 168 180Harding 183 178Eisenhower 179 178Taylor 173 174Garfield 183 187J. Kennedy 183 182Harrison 168 180J. Q. Adams 171 191Clinton 188 188Nixon 182 180Johnson 192 180Hoover 182 180T. Roosevelt 178 175Buchanan 183 175Polk 173 185Refer to the accompanying data set of 20randomly selected presidents. Treat the data as a sample and find the proportion of presidents who were taller than their opponents. Use that result to construct a 95% confidence interval estimate of the population percentage. Based on the result, does it appear that greater height is an advantage for presidential candidates? Why or why not? Construct a 95% confidence interval estimate of the percentage of presidents who were taller than their opponents. PRESIDENT HEIGHT HEIGHT OPPMcKinley 170 178Lincoln 193 188Reagan 185 177Taft 182 178Harrison 173 168Van Buren 168 180Harding 183 178Eisenhower 179 178Taylor 173 174Garfield 183 187J. Kennedy 183 182Harrison 168 180J. Q. Adams 171 191Clinton 188 188Nixon 182 180Johnson 192 180Hoover 182 180T. Roosevelt 178 175Buchanan 183 175Polk 173 185Use the given confidence interval to find the margin of error and the sample proportion. (0.618,0.646) E=nothing (Type an integer or a decimal.) p=nothing (Type an integer or a decimal.)
- To construct a confidence interval for each of the following quantities, say whether it would be better to use paired samples or independent samples. a) The mean difference in height between identical twins. b) The mean difference in height between men and women. c) The mean difference in apartment rents between apartments in two different cities. d) The mean difference in apartment rents in a certain town between this year and last year.Suppose that a safety group surveyed 1,100 drivers. Among those surveyed, 65% said that careless or aggressive driving was the biggest threat on the road, and 25% said that cell phone usage by other drivers was the driving behavior that annoyed them the most. Based on these data and assuming that the sample was a simple random sample, construct and interpret a 95% confidence interval estimate for the true proportion in the population of all drivers who are annoyed by cell phone users. The confidence interval estimate is ??––––––??> (Round to three decimal places as needed. Use ascending order.) Interpret the confidence interval estimate. A. There is a 0.95 probability that the population proportion of drivers who are annoyed by cell phone users is in the interval. B. There is 95% confidence that the population proportion of drivers who are annoyed by cell phone users is in the interval. C. There is 95% confidence that the population proportion…In a survey of 600 personnel directors, 40% thought that they would be hiring new personnel over the next three months. (a) Construct a 97% confidence interval for the proportion of all personnel directors planning to hire personnel over the next three months? (b) What is margin of error used in (a)? (c) Find the necessary sample size, if they wish to be accurate within 3% of the true proportion.


