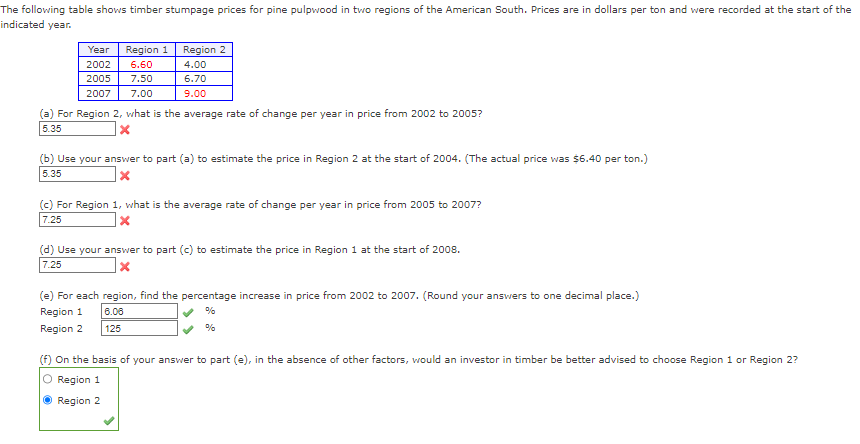
The following table shows timber stumpage prices for pine pulpwood in two regions of the American South. Prices are in dollars per ton and were recorded at the start of the indicated year. Year Region 1 Region 2 2002 6.60 4.00 2005 7.50 6.70 2007 7.00 9.00 (a) For Region 2, what is the average rate of change per year in price from 2002 to 2005? 5.35 x (b) Use your answer to part (a) to estimate the price in Region 2 at the start of 2004. (The actual price was $6.40 per ton.) 5.35 (c) For Region 1, what is the average rate of change per year in price from 2005 to 2007? 7.25 x (d) Use your answer to part (c) to estimate the price in Region 1 at the start of 2008. 7.25 x (e) For each region, find the percentage increase in price from 2002 to 2007. (Round your answers to one decimal place.) Region 1 6.06 Region 2 125 % (f) On the basis of your answer to part (e), in the absence of other factors, would an investor in timber be better advised to choose Region 1 or Region 2? Region 1 Region 2
The following table shows timber stumpage prices for pine pulpwood in two regions of the American South. Prices are in dollars per ton and were recorded at the start of the indicated year. Year Region 1 Region 2 2002 6.60 4.00 2005 7.50 6.70 2007 7.00 9.00 (a) For Region 2, what is the average rate of change per year in price from 2002 to 2005? 5.35 x (b) Use your answer to part (a) to estimate the price in Region 2 at the start of 2004. (The actual price was $6.40 per ton.) 5.35 (c) For Region 1, what is the average rate of change per year in price from 2005 to 2007? 7.25 x (d) Use your answer to part (c) to estimate the price in Region 1 at the start of 2008. 7.25 x (e) For each region, find the percentage increase in price from 2002 to 2007. (Round your answers to one decimal place.) Region 1 6.06 Region 2 125 % (f) On the basis of your answer to part (e), in the absence of other factors, would an investor in timber be better advised to choose Region 1 or Region 2? Region 1 Region 2

Chapter6: Exponential And Logarithmic Functions
Section6.8: Fitting Exponential Models To Data
Problem 3TI: Table 6 shows the population, in thousands, of harbor seals in the Wadden Sea over the years 1997 to...

Related questions
Question
11
Transcribed Image Text:The following table shows timber stumpage prices for pine pulpwood in two regions of the American South. Prices are in dollars per ton and were recorded at the start of the
indicated year.
Year
Region 1 Region 2
6.60
4.00
2002
2005 7.50
6.70
2007 7.00
9.00
(a) For Region 2, what is the average rate of change per year in price from 2002 to 2005?
5.35
X
(b) Use your answer to part (a) to estimate the price in Region 2 at the start of 2004. (The actual price was $6.40 per ton.)
5.35
(c) For Region 1, what is the average rate of change per year in price from 2005 to 2007?
7.25
x
(d) Use your answer to part (c) to estimate the price in Region 1 at the start of 2008.
7.25
X
(e) For each region, find the percentage increase in price from 2002 to 2007. (Round your answers to one decimal place.)
Region 1
6.06
%
Region 2
125
%
(f) On the basis of your answer to part (e), in the absence of other factors, would an investor in timber be better advised to choose Region 1 or Region 2?
O Region 1
Ⓒ Region 2
Expert Solution
This question has been solved!
Explore an expertly crafted, step-by-step solution for a thorough understanding of key concepts.

This is a popular solution!

Trending now
This is a popular solution!

Step by step
Solved in 4 steps with 1 images

Recommended textbooks for you

Linear Algebra: A Modern Introduction
Algebra
ISBN:
9781285463247
Author:
David Poole
Publisher:
Cengage Learning

Linear Algebra: A Modern Introduction
Algebra
ISBN:
9781285463247
Author:
David Poole
Publisher:
Cengage Learning

Trigonometry (MindTap Course List)
Trigonometry
ISBN:
9781337278461
Author:
Ron Larson
Publisher:
Cengage Learning

Algebra & Trigonometry with Analytic Geometry
Algebra
ISBN:
9781133382119
Author:
Swokowski
Publisher:
Cengage

Functions and Change: A Modeling Approach to Coll…
Algebra
ISBN:
9781337111348
Author:
Bruce Crauder, Benny Evans, Alan Noell
Publisher:
Cengage Learning