the following time series dat Quarte Year 11 Time Series Value 2 (a) Construct a time series plot. 22HD987 10 12 Year 2 13 10 12 14 Year 3 14 13 Time Series Value 2543N-C807 12 Time Series Value ==== NOO DOM Time Series Value 1960-NW+54 -
the following time series dat Quarte Year 11 Time Series Value 2 (a) Construct a time series plot. 22HD987 10 12 Year 2 13 10 12 14 Year 3 14 13 Time Series Value 2543N-C807 12 Time Series Value ==== NOO DOM Time Series Value 1960-NW+54 -

A First Course in Probability (10th Edition)
10th Edition
ISBN:9780134753119
Author:Sheldon Ross
Publisher:Sheldon Ross
Chapter1: Combinatorial Analysis
Section: Chapter Questions
Problem 1.1P: a. How many different 7-place license plates are possible if the first 2 places are for letters and...

Related questions
Question
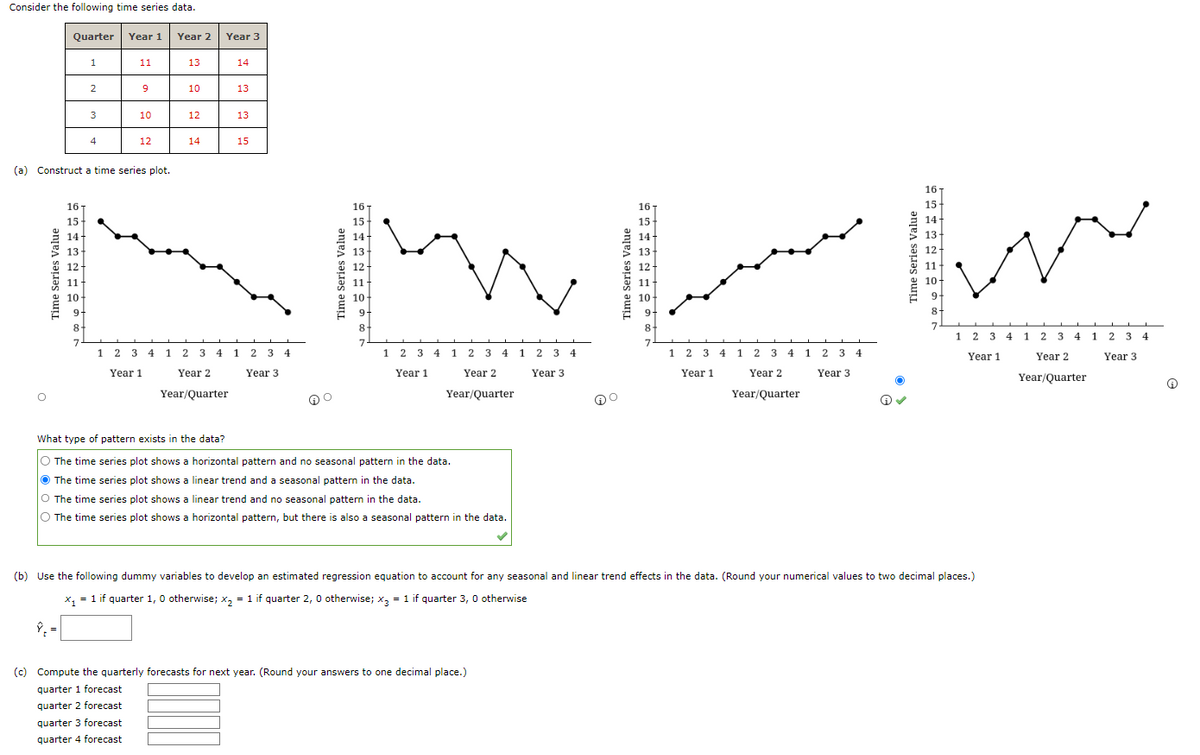
Transcribed Image Text:Consider the following time series data.
Time Series Value
Quarter Year 1
O
1
16-
15-
14-
13-
12-
11+
10-
9-
8
7
2
3
4
11
(a) Construct a time series plot.
9
10
12
1 2 3 4
Year 1
quarter 3 forecast
quarter 4 forecast
Year 2
13
10
12
14
Year 3
1 2 3 4
Year 2
Year/Quarter
14
13
13
15
1 2 3 4
Year 3
Time Series Value
16
15
14-
13
12
11-
10+
9
8+
7
1 2 3 4
Year 1
1 2 3 4
Year 2
Year/Quarter
What type of pattern exists in the data?
O The time series plot shows a horizontal pattern and no seasonal pattern in the data.
The time series plot shows a linear trend and a seasonal pattern in the data.
O The time series plot shows a linear trend and no seasonal pattern in the data.
O The time series plot shows a horizontal pattern, but there is also a seasonal pattern in the data.
(c) Compute the quarterly forecasts for next year. (Round your answers to one decimal place.)
quarter 1 forecast
quarter 2 forecast
1 2 3 4
Year 3
Time Series Value
16 T
15
14
13
12
11
10
16 T
15
14
13
12
mim
11
10
9-
8-
7
8-
7
1 2 3 4 1 2 3 4 1 2 3 4
Year 1
Year 3
Year 2
Year/Quarter
(b) Use the following dummy variables to develop an estimated regression equation to account for any seasonal and linear trend effects in the data. (Round your numerical values to two decimal places.)
x₁ = 1 if quarter 1, 0 otherwise; x₂ = 1 if quarter 2, 0 otherwise; x3 = 1 if quarter 3, 0 otherwise
X3
1 2 3 4 1 2 3 4 1 2 3 4
Year 1
Year 2
Year 3
Year/Quarter
Expert Solution
This question has been solved!
Explore an expertly crafted, step-by-step solution for a thorough understanding of key concepts.

This is a popular solution!

Trending now
This is a popular solution!

Step by step
Solved in 3 steps with 2 images

Recommended textbooks for you
A First Course in Probability (10th Edition)
Probability
ISBN:
9780134753119
Author:
Sheldon Ross
Publisher:
PEARSON

A First Course in Probability (10th Edition)
Probability
ISBN:
9780134753119
Author:
Sheldon Ross
Publisher:
PEARSON