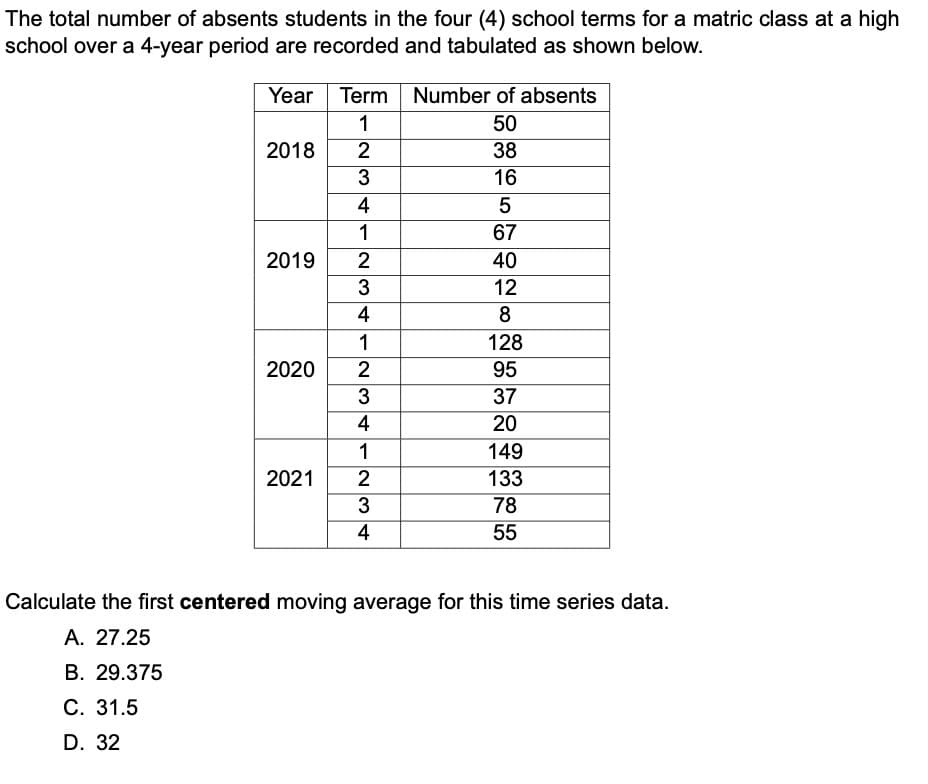
The total number of absents students in the four (4) school terms for a matric class at a high school over a 4-year period are recorded and tabulated as shown below. Year Term Number of absents 1 50 2018 2 38 16 4 5 1 67 2019 2 40 3 12 4 8 1 128 2020 2 95 3 37 4 20 1 149 2021 2 133 3 78 4 55 Calculate the first centered moving average for this time series data. A. 27.25 В. 29.375 С. 31.5 D. 32


Q: "An electrical firm produces light bulbs that have a length of life that is approximately normally…
A:
Q: A distribution of values is normal with a mean of 200.9 and a standard deviation of 57.7. Find P83,…
A:
Q: O B. Yes, the pulse rate of beats per minute appears to be an outlier because it is far away from…
A: Answer 77) The expression Zα denote the Z score with an area of αto its right. p(z>zα)=α
Q: 5.38 The paper "Accelerated Telomere Shortening in Response to Life Stress" (Proceedings of the…
A: Regression line has two variables and two regression coefficients. Two variables are independent and…
Q: 20. Ron and Sandy have purchased their first house. They borrowed $174, 000 for 30 years at an…
A:
Q: Arandom sample of 197 students was asked how many songs were in their digtal music library and what…
A: * SOLUTION :- from the given information the answer is provided as below ,
Q: find the t sub alpha/2 when n=23 for the 95% confidence interval
A:
Q: A product engineer wants to optimize the cutting of strips of wood, which are used to make plywood.…
A: Hello! As you have posted more than 3 sub parts, we are answering the first 3 sub-parts. In case…
Q: Summarize
A: It provides more content that is useful for practical application. It uses a smaller sample size…
Q: A research report describing the results from a repeated-measures t test states, “t(22) = 1.01, p >…
A: Lets say level of significance alpha=0.05.
Q: The phrase "95 % confidence" in a confidence statement means that A) 95% of the population falls…
A: A confidence interval (CI) is a group of values that will almost certainly encompass a population…
Q: Is a weight loss program based on exercise more effective than a program based on diet? The 57…
A:
Q: e the set of points to compute the following. The slope of the regression line for this data is…
A: Given that n= 8 Confidence level = 0.95 Alpha = 1- 0.95 = 0.05 Degrees of freedom = n -2 = 8 -…
Q: Using a-.01, appropriate decision is
A: here given table of Investment objective and Industry sector
Q: Jse the set of points to compute the following. The slope of the regression line for this data is…
A:
Q: Given the relation and link to the data in Desmos below, (note you can click on "edit graph on…
A: Scatter plot is the graphical representation of the relationship between two variables of a…
Q: 54. Interpret the confidence level. If Leila and Valerie were to (repeat this experiment or select…
A: Confidence interval is an alternative to hypothesis testing.
Q: n testing these hypotheses, which of the following would be strong evidence against the null…
A:
Q: Researchers measured the data speeds for a particular smartphone carrier at 50 airports. The highest…
A:
Q: A telemarketer at a credit card company is instructed to ask the next 10 customers that call into…
A: a) Assumptions and conditions: Here, the probability of success is p=0.9=910 and the probability of…
Q: The mean, mode and median of 4 datasets are shown below. mean median mode Dataset 1 65 90 95 Dataset…
A: Given data
Q: Consider the fallowing extensive form game with two players, 1and 2. 1. B3 (4,1) 1. -- -- - (552)…
A:
Q: For males born in upstate NY, the gestation times are normally distributed with a mean of 39 weeks…
A: Given, for males born in upstate NY, the gestation times are normally distributed with a mean of 39…
Q: ypothesis Hi, has pdf 1, P;(y) = 0<y<1 0, otherwise. Bayes rule and minimum Bayes risk for testing…
A: *Answer:
Q: A die is rolled 120 times to see if it is fair. The table below shows the frequencies for each of…
A:
Q: Let X and Y be independent random variables. X is N(1,9) and Y is uniform on the interval {-1, 1].…
A: Given that Let X and Y be independent random variables. X is N(1,9) and Y is uniform on the…
Q: Listed below are the numbers of words spoken in a day by each member of eight different randomly…
A: Given: Male Female 16166 24943 26007 13042 1453 18993 7712 18457 18209 13454 16059…
Q: The average price of an instrument at a small music store is $345. The standard deviation of the…
A:
Q: 9.24 Consider the e-billing case. The mean and the standard deviation of the sample of n = 65…
A:
Q: 87 qnd 88 solve both plzz
A:
Q: If øx(@) is a characteristic function of a random variable X, then , (co) = 6, (@), where c is a…
A:
Q: The summary statistics for a certain set of points are: n = 25, s̟ = 2.50, E (x-x)¯ = 250.12, and b,…
A: The summary of statistics is, The degree of freedom is, df=n-2 =25-2 =23 Critical value:…
Q: Recreational Time A researcher wishes to see if there is a difference between the mean number of…
A: Given that A researcher wishes to see if there is a difference between the mean number of hours per…
Q: The commercial for the new Meat Man Barbecue claims that it takes 18 minutes for assembly. A…
A:
Q: In a large online music database 15% of the songs are from the K-Pop genre. A random sample of ten…
A:
Q: 10. A recent study indicates that people tend to select video game avatars with characteristics like…
A: It needed to test whether there is a significant relationship between the personalities of the…
Q: A Markov chain {s}... with state space N={1, 2, 3} has a sequence of realizations and process…
A: The objective is to obtain the transition frequency matrix, followed by the transition probability…
Q: (AKS 23): Mr. Smith looked at the scores from 2 different Math classes, as shown on the dot plots…
A: The dotplot for the class 1 is displayed below. The observed data from the plot is,…
Q: You intend to estimate a population mean with a confidence interval. You believe the population to…
A:
Q: Not all visitors to a certain company's website are customers. In fact, the website administrator…
A:
Q: Suppose the following S shape of the total cost curve can be captured by the following cubic or…
A:
Q: This problem is inspired by a study of the "gender gap" in earnings in top corporate jobs (Bertrand…
A: Hello! As you have posted more than 3 sub parts, we are answering the first 3 sub-parts. In case…
Q: For an analysis of variance (ANOVA) comparing four treatment conditions, dfbetween = 3. True False
A: We need to choose appropriate option(true or false) for given statement. For an analysis of variance…
Q: What make the Chi square distribution a special case of the Gamma Distribution?
A: We need to show, what make the Chi square distribution a special case of the Gamma Distribution.
Q: Instruction. Evaluate the following sequences. A. SEQUENCE 1. A sequence is given by the formula a,…
A: “Since you have asked multiple questions, we will solve the first question for you. If you want any…
Q: Identify the sampling techniques used, and discuss potential sources of bias (if any). Explain.…
A: We need to, Identify the sampling techniques used, and discuss potential sources of bias (if any).…
Q: "It is claimed that a car is driven on the average less than 18100 kilometers per year with a…
A: Given that, it is claimed that a car is driven on the average less than 18100 kilometers per year…
Q: study was conducted on students from a particular high school over the last 8 years. The following…
A:
Q: To qualify for a job at Skourald Inc. a candidate must place in the top 15% on a performance test.…
A: Given that To qualify a job a candidate must place in the top 15% on a performance test. The…
Q: The average square footage of a U.S. single-family home is 2750 square feet with a standard…
A:
Calculate the first centered moving average for this time series data

Step by step
Solved in 2 steps with 2 images

- The table below contains the average price paid for a new home in a certain area from 2000 to 2010. a. Construct a time-series plot of new home prices. b. What pattern, if any, is present in the data? Year Average_Price_($_thousands)2000 351.12001 330.52002 310.52003 296.72004 229.72005 182.32006 154.52007 156.32008 154.72009 154.52010 154.5Consider the following time series data Month 1 2 3 4 5 6 7 8 9 10 11 12 Value 90 89 86 91 90 91 88 86 91 93 90 88 a) Construct a time series plot in Excel. Label the axes and graph. c) Develop a smoothing model forecast with α = 0.35. Compute MSE and forecast for month 13 d) Which model is the better predictor? Why?#4) Commuter ridership in Athens, Greece, during the summer months is believed to be heavily tied to the number of tourists visiting the city. During the past 12 years, the data are given in the following table. Year Number of Tourists (millions) Ridership (hundreds of thousands) 1 6 11 2 11 16 3 8 16 4 10 14 5 19 28 6 18 26 7 16 21 8 20 25 9 24 45 10 18 28 11 11 18 12 19 35 a) Create a time series plot for the ridership. b) Using linear regression to see if using the year is a good predictor for the ridership. What is the regression equation? How accurate is the model? c) Using linear regression to see if using the number of tourists is a good predictor for the ridership. What is the regression equation? How accurate is the model? d) Which linear regression equation is better? What is the expected ridership if 10 million tourists visit the city next year? e) Excel File
- Which of the following time series forecasting methods would not be used to forecast seasonal data?The following data set provides the total number of shipments of core major household appliances in the U.S. from 2000 to 2016 (in millions): Year Shipments (millions) 2000 38.4 2001 38.2 2002 40.8 2003 42.5 2004 46.1 2005 47.0 2006 46.7 2007 44.1 2008 39.8 2009 36.5 2010 38.2 2011 36.0 2012 35.8 2013 39.2 2014 41.5 2015 42.9 2016 44.7 a. Plot the time series. b. Fit a three-year moving average to the data and plot the results. c. Fit a five-year moving average to the data and plot the results. d. Compute a linear trend forecasting equation and plot the trend line. e. Compute a quadratic trend forecasting equation and plot the results.Consider the following time series data. Choose the correct time series plot. (i) (ii) (iii) (iv) Plot (ii) What type of pattern exists in the data?Horizontal Pattern Develop a three-week moving average for this time series. Compute MSE and a forecast for week 7. If required, round your answers to two decimal places. Week Time SeriesValue Forecast 1 18 2 13 3 16 4 11 fill in the blank 3 5 17 fill in the blank 4 6 14 fill in the blank 5 MSE: fill in the blank 6The forecast for week 7: fill in the blank 7 Use α = 0.2 to compute the exponential smoothing values for the time series. Compute MSE and a forecast for week 7. If required, round your answers to two decimal places. Week Time SeriesValue Forecast 1 18 2 13 fill in the blank 8 3 16 fill in the blank 9 4 11 fill in the blank 10 5 17 fill in the blank 11 6 14 fill in the blank 12 MSE: fill in the blank 13The forecast for week 7: fill in the blank 14
- Consider the following time series data Month 1 2 3 4 5 6 7 8 9 10 11 12 Value 90 89 86 91 90 91 88 86 91 93 90 88 a) Construct a time series plot in Excel. Label the axes and graph. b) Develop a five month moving average forecast. Compute MSE and a forecast for month 13. c) Develop a smoothing model forecast with α = 0.35. Compute MSE and forecast for month 13 d) Which model is the better predictor? Why?Refer to the gasoline sales time series data in the given table. Compute four-week and five-week moving averages for the time series. Round your answers to two decimal places. Compute the MSE for the four-week and five-week moving average forecasts. Round your intermediate calculations and final answers to two decimal places. What appears to be the best number of weeks of past data (three, four, or five) to use in the moving average computation? Recall that MSE for the three-week moving average is 12.89.Using the time series data in the table, respond to the following items. Period Sales 1 $ 615 2 676 3 761 4 710 5 784 6 801 7 852 8 698 9 1,193 10 1,115 11 1,231 12 1,259 13 1,495 14 1,229 15 1,652 16 1,337 17 1,673 18 1,613 Please show work, thanks.
- Using the time series data in the table, respond to the following items. Period Sales 1 $ 615 2 678 3 761 4 710 5 784 6 801 7 852 8 698 9 1,193 10 1,115 11 1,231 12 1,259 13 1,495 14 1,229 15 1,652 16 1,337 17 1,673 18 1,613 d-1. Compute all possible forecasts using a trend forecasting model using simple linear regression? (Round your answers to 3 decimal places.) Period Sales Predicted Sales Absolute Error 1 615 2 678 3 761 4 710 5 784 6 801 7 852 8 698 9 1,193 10 1,115 11 1,231 12 1,259 13 1,495 14 1,229 15 1,652 16 1,337 17 1,673 18 1,613 d-2. What is the MAD? (Round your answer to 3 decimal places.) d-3. What is the trend equation based on the regression analysis? (Round your answers to 3 decimal places.) Sales = __________ + _______________ time…The quarterly sales data (number of copies sold) for Moraga Bookstore over the past three years follow. Year Quarter 1 Quarter 2 Quarter 3 Quarter 4 1 16 25 22 15 2 19 31 25 18 3 21 33 27 17 Construct a time-series plot. What type of pattern(s) exists in the data? Compute the seasonal index for the four quarters. ]Compute the linear trend equation for the deseasonalized data.Consider the following gasoline sales time series data. Click on the datafile logo to reference the data. Week Sales (1000s of gallons) 1 16 2 20 3 20 4 23 5 18 6 17 8 19 9 23 10 19 11 14 12 21 a. Using a weight of 1/2 for the most recent observation, 1/3 for the second most recent observation, and 1/6 the most recent observation, compute a three-week weighted moving average for the time series (to 2 decimals). Enter negative values as negative numbers. Week Time-Series Value Weighted MovingAverage Forecast ForecastError (Error)2 1 2 3 4 5 6 7 8 9 10 11 12 Total b. Compute the MSE for the weighted moving average in part (a).MSE = Do you prefer this weighted moving average to the unweighted moving average? Remember that…