The following time series shows the sales of a particular product over the past months. Month Sales Month Sales 1 105 7 145 2 135 8 140 3 120 9 100 4 105 10 80 5 90 11 100 6 120 12 110 a. Construct a time series plot. b and c are shown in pictures. please help asap.
The following time series shows the sales of a particular product over the past months. Month Sales Month Sales 1 105 7 145 2 135 8 140 3 120 9 100 4 105 10 80 5 90 11 100 6 120 12 110 a. Construct a time series plot. b and c are shown in pictures. please help asap.

Algebra & Trigonometry with Analytic Geometry
13th Edition
ISBN:9781133382119
Author:Swokowski
Publisher:Swokowski
Chapter5: Inverse, Exponential, And Logarithmic Functions
Section: Chapter Questions
Problem 9T

Related questions
Question
100%
The following time series shows the sales of a particular product over the past months.
| Month | Sales | Month | Sales | |||||
|---|---|---|---|---|---|---|---|---|
| 1 | 105 | 7 | 145 | |||||
| 2 | 135 | 8 | 140 | |||||
| 3 | 120 | 9 | 100 | |||||
| 4 | 105 | 10 | 80 | |||||
| 5 | 90 | 11 | 100 | |||||
| 6 | 120 | 12 | 110 |
a. Construct a time series plot.
b and c are shown in pictures. please help asap.
Transcribed Image Text:12
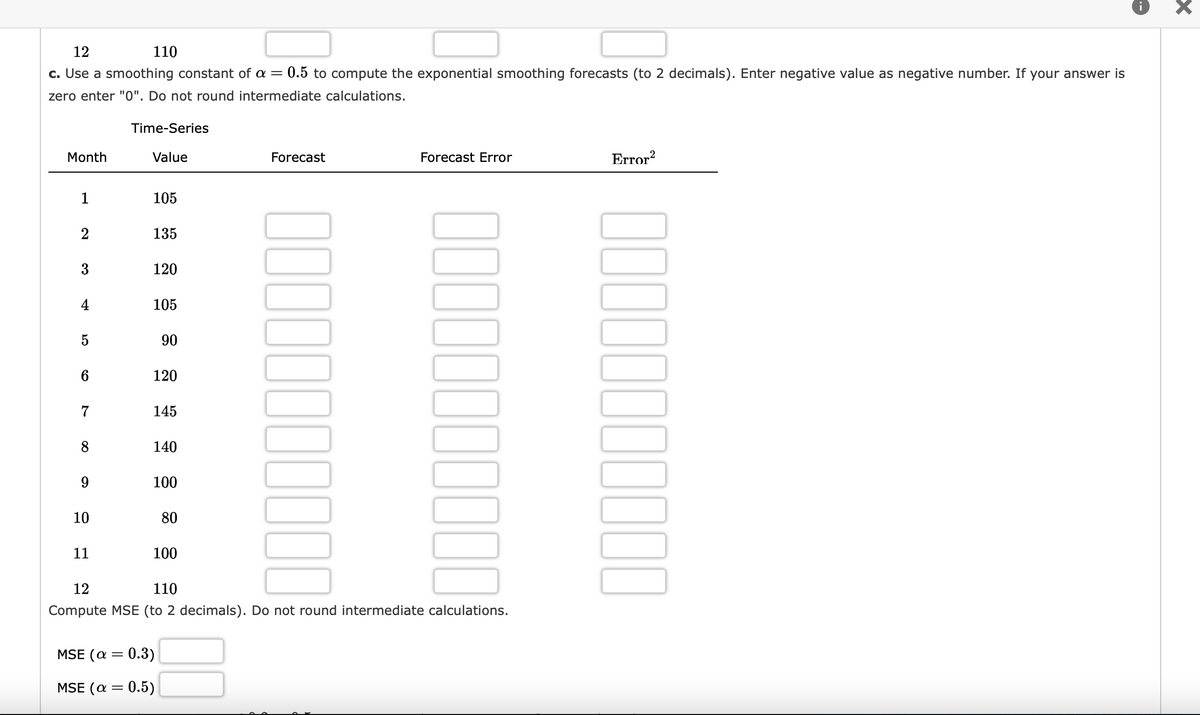
c. Use a smoothing constant of a = 0.5 to compute the exponential smoothing forecasts (to 2 decimals). Enter negative value as negative number. If your answer is
zero enter "0". Do not round intermediate calculations.
Month
1
2
4
5
6
7
8
9
10
110
11
Time-Series
Value
105
135
120
105
90
120
145
140
100
80
100
MSE (α = 0.3)
MSE (α = 0.5)
Forecast
Forecast Error
12
110
Compute MSE (to 2 decimals). Do not round intermediate calculations.
Error²
☐☐☐☐☐☐☐☐☐☐☐
00000000000
00000000000
X
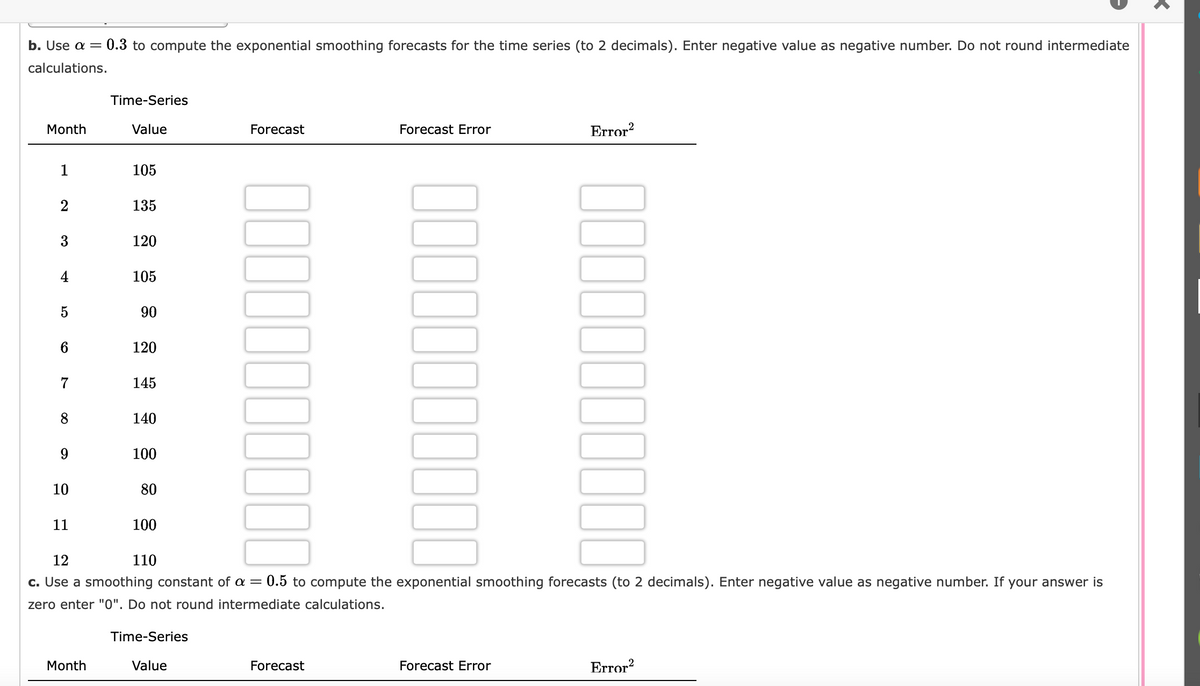
Transcribed Image Text:b. Use a = 0.3 to compute the exponential smoothing forecasts for the time series (to 2 decimals). Enter negative value as negative number. Do not round intermediate
calculations.
Month
1
6
7
8
9
10
11
Time-Series
Value
Month
105
135
120
105
90
120
145
140
100
80
100
Forecast
Time-Series
Value
00000000000
Forecast Error
12
110
c. Use a smoothing constant of a
=
0.5 to compute the exponential smoothing forecasts (to 2 decimals). Enter negative value as negative number. If your answer is
zero enter "0". Do not round intermediate calculations.
Forecast
Error²
00000000000
00000000000
Forecast Error
Error²
K
Expert Solution
This question has been solved!
Explore an expertly crafted, step-by-step solution for a thorough understanding of key concepts.

This is a popular solution!

Trending now
This is a popular solution!

Step by step
Solved in 5 steps with 2 images

Recommended textbooks for you
Algebra & Trigonometry with Analytic Geometry
Algebra
ISBN:
9781133382119
Author:
Swokowski
Publisher:
Cengage
Algebra & Trigonometry with Analytic Geometry
Algebra
ISBN:
9781133382119
Author:
Swokowski
Publisher:
Cengage