The following two sets of Excel output use are from the same data set as described above, but the first set of output is for the set of 35 CEO’s that earn the lowest total compensation and the second set of output is for a set of 40 CEO’s that earn the highest total compensation. a) What is heteroscedasticity? b) Why is heteroscedasticity a problem? c) Based on a comparison of the two sets of output, does it appear that there is heteroscedasticity in the data set? Explain.
The following two sets of Excel output use are from the same data set as described above, but the first set of output is for the set of 35 CEO’s that earn the lowest total compensation and the second set of output is for a set of 40 CEO’s that earn the highest total compensation. a) What is heteroscedasticity? b) Why is heteroscedasticity a problem? c) Based on a comparison of the two sets of output, does it appear that there is heteroscedasticity in the data set? Explain.

Linear Algebra: A Modern Introduction
4th Edition
ISBN:9781285463247
Author:David Poole
Publisher:David Poole
Chapter7: Distance And Approximation
Section7.3: Least Squares Approximation
Problem 30EQ

Related questions
Question
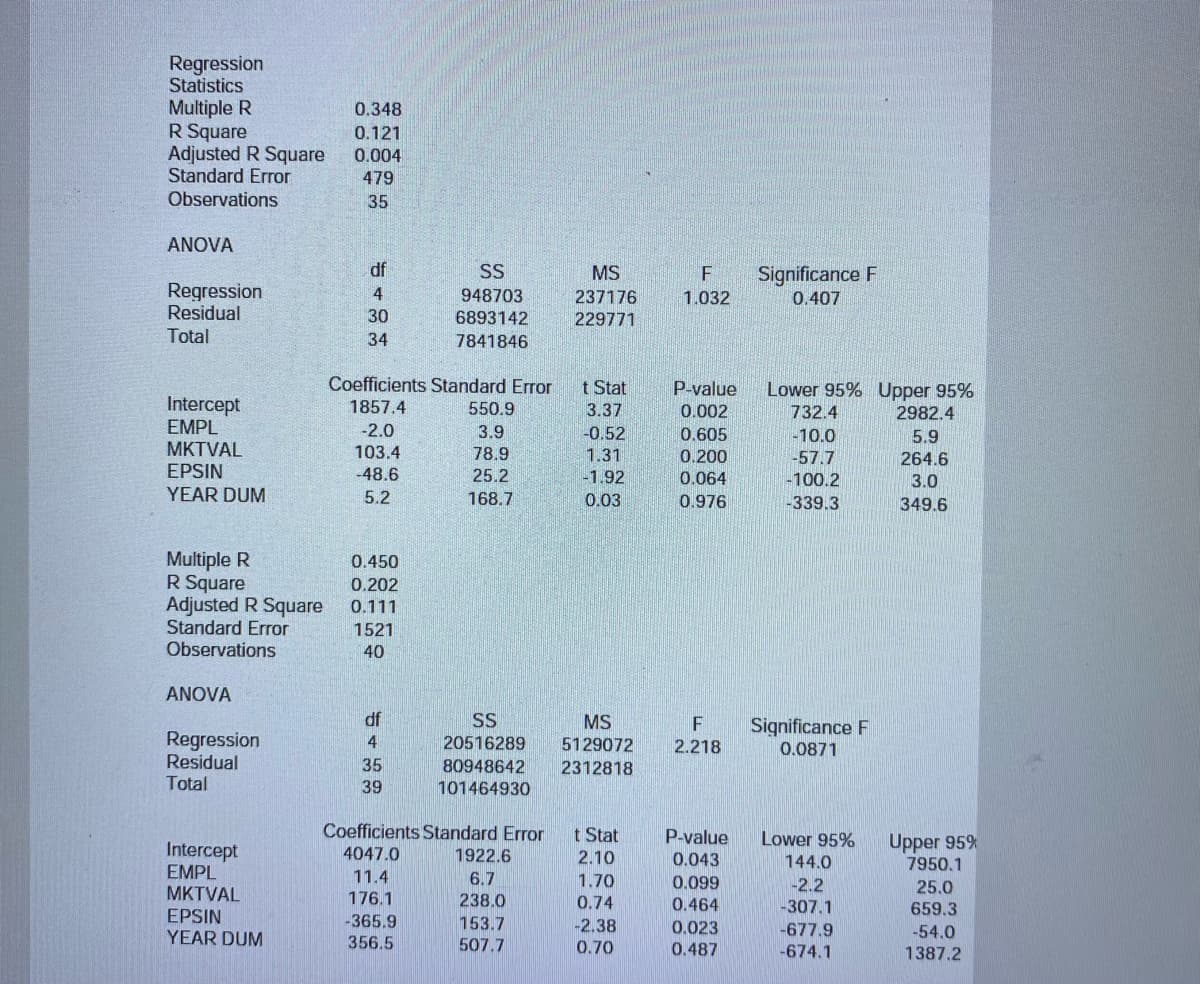
3) The following two sets of Excel output use are from the same data set as described above, but the first set of output is for the set of 35 CEO’s that earn the lowest total compensation and the second set of output is for a set of 40 CEO’s that earn the highest total compensation.
a) What is heteroscedasticity?
b) Why is heteroscedasticity a problem?
c) Based on a comparison of the two sets of output, does it appear that there is heteroscedasticity in the data set? Explain.
Transcribed Image Text:Regression
Statistics
Multiple R
R Square
Adjusted R Square
Standard Error
0.348
0.121
0.004
479
Observations
35
ANOVA
df
SS
MS
Significance F
Regression
Residual
4
948703
237176
1.032
0.407
30
6893142
229771
Total
34
7841846
門TTIITT
Coefficients Standard Error
t Stat
Intercept
EMPL
P-value
0.002
Lower 95% Upper 95%
732.4
1857.4
550.9
3.37
2982.4
-2.0
3.9
-0.52
0.605
-10.0
5.9
МKTVAL
EPSIN
103.4
78.9
1.31
0.200
-57.7
264.6
-48.6
25.2
-1.92
0.064
-100.2
3.0
YEAR DUM
5.2
168.7
0.03
0.976
-339.3
349.6
Multiple R
R Square
Adjusted R Square
Standard Error
Observations
0.450
0.202
0.111
1521
40
ANOVA
df
SS
MS
5129072
F
Significance F
Regression
Residual
Total
4
20516289
2.218
0.0871
35
80948642
2312818
39
101464930
Coefficients Standard Error
t Stat
P-value
Lower 95%
Upper 95%
7950.1
Intercept
EMPL
MKTVAL
EPSIN
YEAR DUM
4047.0
1922.6
2.10
0.043
144.0
11.4
176.1
6.7
1.70
0.099
-2.2
-307.1
25.0
238.0
0.74
0.464
659.3
-365.9
153.7
-2.38
0.70
0.023
-677.9
-54.0
1387.2
356.5
507.7
0.487
-674.1
Expert Solution
This question has been solved!
Explore an expertly crafted, step-by-step solution for a thorough understanding of key concepts.

Step by step
Solved in 4 steps with 3 images

Recommended textbooks for you
Linear Algebra: A Modern Introduction
Algebra
ISBN:
9781285463247
Author:
David Poole
Publisher:
Cengage Learning

Functions and Change: A Modeling Approach to Coll…
Algebra
ISBN:
9781337111348
Author:
Bruce Crauder, Benny Evans, Alan Noell
Publisher:
Cengage Learning
Linear Algebra: A Modern Introduction
Algebra
ISBN:
9781285463247
Author:
David Poole
Publisher:
Cengage Learning
Functions and Change: A Modeling Approach to Coll…
Algebra
ISBN:
9781337111348
Author:
Bruce Crauder, Benny Evans, Alan Noell
Publisher:
Cengage Learning