The following graph shows the approximate number (in thousands) of people who emigrated from Ireland during the period 2010–2014 ( is time in years since 2010) During which 2-year interval(s) was the magnitude of the average rate of change of E(t) greatest least? Interpret your answers by referring to the rates of change.
The following graph shows the approximate number (in thousands) of people who emigrated from Ireland during the period 2010–2014 ( is time in years since 2010) During which 2-year interval(s) was the magnitude of the average rate of change of E(t) greatest least? Interpret your answers by referring to the rates of change.

Algebra & Trigonometry with Analytic Geometry
13th Edition
ISBN:9781133382119
Author:Swokowski
Publisher:Swokowski
Chapter2: Equations And Inequalities
Section2.1: Equations
Problem 70E

Related questions

Question
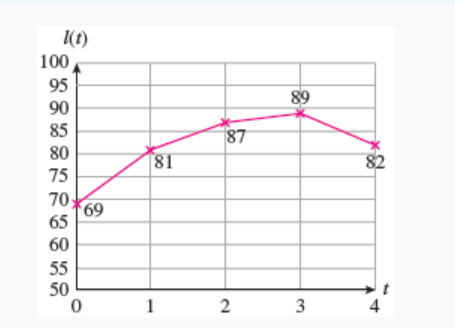
The following graph shows the approximate number (in thousands) of people who emigrated from Ireland during the period 2010–2014 ( is time in years since 2010)
During which 2-year interval(s) was the magnitude of the average rate of change of E(t)
-
greatest
-
least? Interpret your answers by referring to the rates of change.
Transcribed Image Text:l(t)
100
95
89
90
85
80
87
81
82
75
70,
69,
65
60
55
50
1
3
4
Expert Solution
This question has been solved!
Explore an expertly crafted, step-by-step solution for a thorough understanding of key concepts.

This is a popular solution!

Trending now
This is a popular solution!

Step by step
Solved in 2 steps with 1 images

Knowledge Booster


Learn more about
Need a deep-dive on the concept behind this application? Look no further. Learn more about this topic, calculus and related others by exploring similar questions and additional content below.Recommended textbooks for you
Algebra & Trigonometry with Analytic Geometry
Algebra
ISBN:
9781133382119
Author:
Swokowski
Publisher:
Cengage

College Algebra (MindTap Course List)
Algebra
ISBN:
9781305652231
Author:
R. David Gustafson, Jeff Hughes
Publisher:
Cengage Learning
Algebra & Trigonometry with Analytic Geometry
Algebra
ISBN:
9781133382119
Author:
Swokowski
Publisher:
Cengage
College Algebra (MindTap Course List)
Algebra
ISBN:
9781305652231
Author:
R. David Gustafson, Jeff Hughes
Publisher:
Cengage Learning