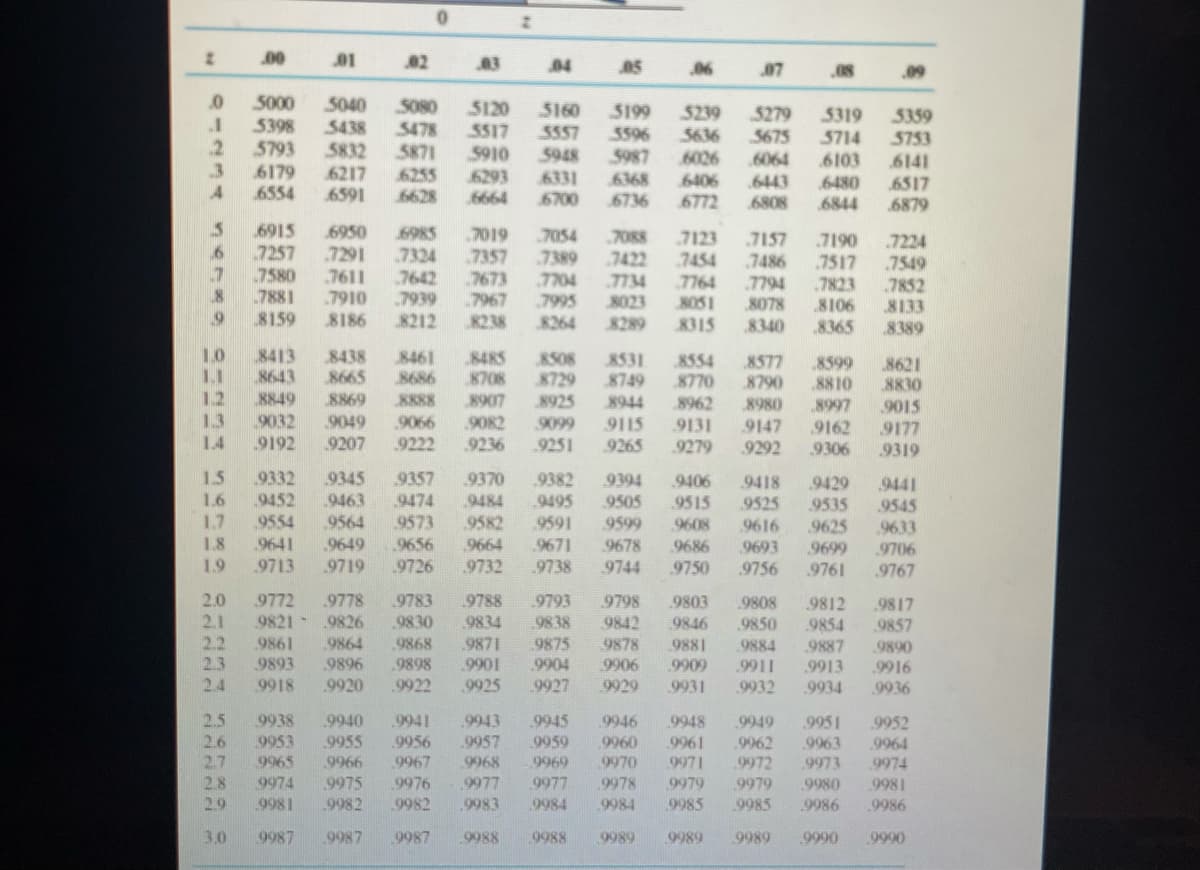
The Food Marketing Institute shows that 18% of households spend more than $100 per week on groceries. Assume the population proportion is p = 0.18 and a sample of 800 households will be selected from the population. Use z-table. a. Calculate oơ(P), the standard error of the proportion of households spending more than $100 per week on groceries (to 4 decimals). b. What is the probability that the sample proportion will be within +/- 0.02 of the population proportion (to 4 decimals)? c. What is the probability that the sample proportion will be within +/- 0.02 of the population proportion for a sample of 1,600 households (to 4 decimals)?
The Food Marketing Institute shows that 18% of households spend more than $100 per week on groceries. Assume the population proportion is p = 0.18 and a sample of 800 households will be selected from the population. Use z-table. a. Calculate oơ(P), the standard error of the proportion of households spending more than $100 per week on groceries (to 4 decimals). b. What is the probability that the sample proportion will be within +/- 0.02 of the population proportion (to 4 decimals)? c. What is the probability that the sample proportion will be within +/- 0.02 of the population proportion for a sample of 1,600 households (to 4 decimals)?

MATLAB: An Introduction with Applications
6th Edition
ISBN:9781119256830
Author:Amos Gilat
Publisher:Amos Gilat
Chapter1: Starting With Matlab
Section: Chapter Questions
Problem 1P

Related questions

Question
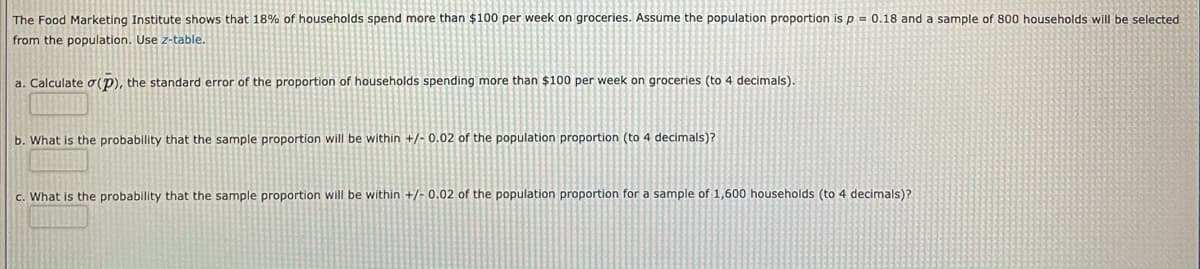
Transcribed Image Text:The Food Marketing Institute shows that 18% of households spend more than $100 per week on groceries. Assume the population proportion is p = 0.18 and a sample of 800 households will be selected
from the population. Use z-table.
a. Calculate 0(P), the standard error of the proportion of households spending more than $100 per week on groceries (to 4 decimals).
b. What is the probability that the sample proportion will be within +/- 0.02 of the population proportion (to 4 decimals)?
c. What is the probability that the sample proportion will be within +/- 0.02 of the population proportion for a sample of 1,600 households (to 4 decimals)?
Transcribed Image Text:00
01
02
03
04
05
06
J07
O8
09
5000
5398
5040
S080
5120
5517
5910
3160
5557
3199
3596
5987
5239
5636
6026
5279
5675
3319
5714
6103
3359
5753
5438
5478
.2
5793
5832
5871
5948
6064
6141
6179
6217
6591
6255
6628
6293
6331
6700
6368
6406
6443
6808
6517
6879
6480
6554
6664
6736
6772
6844
6915
7257
7580
6950
7291
7611
6985
7324
7642
7939
8212
7019
7054
7389
7704
7995
8264
7088
7123
7454
7157
7486
7190
.7224
7549
7357
7673
7967
7422
7734
8023
8289
7517
7823
8106
7881
8159
7764
8051
7794
8078
7852
8133
8389
7910
8186
8238
8315
8340
8365
1.0
11
8413
8643
8438
8665
8461
8686
8485
8708
8S08
8729
8925
8531
8749
8554
8770
8577
8790
8599
8810
8997
8621
8830
12
1.3
8849
9032
9192
8907
.9082
9236
8869
8888
8944
8962
9131
9279
8980
9015
9066
9222
9049
9099
9115
9147
9292
9162
9177
1.4
9207
9251
9265
9306
9319
1.5
9332
9452
9357
9474
9345
9382
9495
9591
9370
9394
9406
9418
9525
9616
9429
9441
1.6
9463
9484
9505
9599
9515
9535
9545
1.7
9554
9641
9564
9573
9582
9608
9625
9633
.9706
.9767
1.8
.9649
.9719
9656
9664
9671
9678
9686
9693
9699
1.9
9713
9726
9732
9738
9744
9750
.9756
.9761
.9778
9826
2.0
2.1
2.2
2.3
2.4
9772
9783
9788
9834
9793
9838
9798
9803
9812
9808
.9850
.9817
9857
9821
9830
9842
9878
9846
9854
9861
9864
9868
9871
.9901
9925
9875
9904
9881
9884
.9887
.9890
9893
9918
.9896
.9898
9906
9909
.9911
9932
.9913
.9916
.9920
.9922
9927
9929
9931
9934
9936
9938
9953
9965
.9940
9955
.9943
.9957
2.5
9949
.9962
9972
.9979
.9941
9945
9946
9948
9951
9952
2.6
9956
9959
.9960
9961
9963
.9964
2.7
2.8
2.9
9966
9967
.9968
9969
9970
9971
.9973
9974
9974
9975
9976
.9977
9977
9978
9979
.9980
9981
9981
9982
9982
.9983
9984
9984
9985
9985
9986
.9986
30
9987
9987
9987
9988
9988
9989
9989
9989
.9990
9990
Expert Solution
This question has been solved!
Explore an expertly crafted, step-by-step solution for a thorough understanding of key concepts.

This is a popular solution!

Trending now
This is a popular solution!

Step by step
Solved in 3 steps

Knowledge Booster


Learn more about
Need a deep-dive on the concept behind this application? Look no further. Learn more about this topic, statistics and related others by exploring similar questions and additional content below.Recommended textbooks for you
MATLAB: An Introduction with Applications
Statistics
ISBN:
9781119256830
Author:
Amos Gilat
Publisher:
John Wiley & Sons Inc

Probability and Statistics for Engineering and th…
Statistics
ISBN:
9781305251809
Author:
Jay L. Devore
Publisher:
Cengage Learning

Statistics for The Behavioral Sciences (MindTap C…
Statistics
ISBN:
9781305504912
Author:
Frederick J Gravetter, Larry B. Wallnau
Publisher:
Cengage Learning
MATLAB: An Introduction with Applications
Statistics
ISBN:
9781119256830
Author:
Amos Gilat
Publisher:
John Wiley & Sons Inc
Probability and Statistics for Engineering and th…
Statistics
ISBN:
9781305251809
Author:
Jay L. Devore
Publisher:
Cengage Learning
Statistics for The Behavioral Sciences (MindTap C…
Statistics
ISBN:
9781305504912
Author:
Frederick J Gravetter, Larry B. Wallnau
Publisher:
Cengage Learning

Elementary Statistics: Picturing the World (7th E…
Statistics
ISBN:
9780134683416
Author:
Ron Larson, Betsy Farber
Publisher:
PEARSON

The Basic Practice of Statistics
Statistics
ISBN:
9781319042578
Author:
David S. Moore, William I. Notz, Michael A. Fligner
Publisher:
W. H. Freeman

Introduction to the Practice of Statistics
Statistics
ISBN:
9781319013387
Author:
David S. Moore, George P. McCabe, Bruce A. Craig
Publisher:
W. H. Freeman