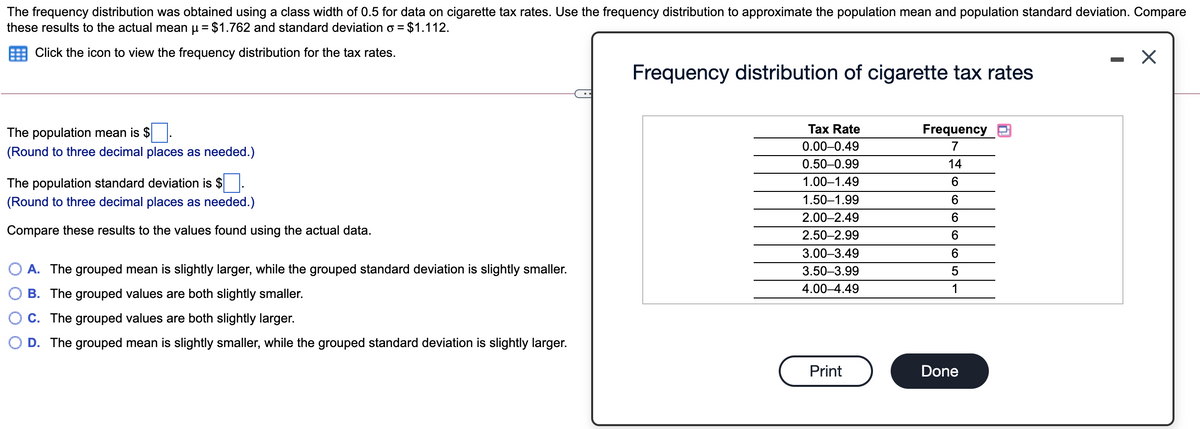
The frequency distribution was obtained using a class width of 0.5 for data on cigarette tax rates. Use the frequency distribution to approximate the population mean and population standard deviation. Compare these results to the actual mean μ=$1.762 and standard deviation σ=$1.112.
The frequency distribution was obtained using a class width of 0.5 for data on cigarette tax rates. Use the frequency distribution to approximate the population mean and population standard deviation. Compare these results to the actual mean μ=$1.762 and standard deviation σ=$1.112.

Glencoe Algebra 1, Student Edition, 9780079039897, 0079039898, 2018
18th Edition
ISBN:9780079039897
Author:Carter
Publisher:Carter
Chapter10: Statistics
Section10.4: Distributions Of Data
Problem 22PFA

Related questions
Question
The frequency distribution was obtained using a class width of 0.5 for data on cigarette tax rates. Use the frequency distribution to approximate the population mean and population standard deviation. Compare these results to the actual mean μ=$1.762 and standard deviation σ=$1.112.
Transcribed Image Text:The frequency distribution was obtained using a class width of 0.5 for data on cigarette tax rates. Use the frequency distribution to approximate the population mean and population standard deviation. Compare
these results to the actual mean u = $1.762 and standard deviation o = $1.112.
Click the icon to view the frequency distribution for the tax rates.
Frequency distribution of cigarette tax rates
The population mean is $
Tax Rate
Frequency
0.00-0.49
7
(Round to three decimal places as needed.)
0.50-0.99
14
The population standard deviation is $.
1.00–1.49
(Round to three decimal places as needed.)
1.50–1.99
2.00–2.49
6.
Compare these results to the values found using the actual data.
2.50–2.99
3.00–3.49
6.
O A. The grouped mean is slightly larger, while the grouped standard deviation is slightly smaller.
3.50-3.99
4.00–4.49
1
B. The grouped values are both slightly smaller.
C. The grouped values are both slightly larger.
O D. The grouped mean is slightly smaller, while the grouped standard deviation is slightly larger.
Print
Done
Expert Solution
This question has been solved!
Explore an expertly crafted, step-by-step solution for a thorough understanding of key concepts.

This is a popular solution!

Trending now
This is a popular solution!

Step by step
Solved in 3 steps with 3 images

Recommended textbooks for you
Glencoe Algebra 1, Student Edition, 9780079039897…
Algebra
ISBN:
9780079039897
Author:
Carter
Publisher:
McGraw Hill

Big Ideas Math A Bridge To Success Algebra 1: Stu…
Algebra
ISBN:
9781680331141
Author:
HOUGHTON MIFFLIN HARCOURT
Publisher:
Houghton Mifflin Harcourt
Glencoe Algebra 1, Student Edition, 9780079039897…
Algebra
ISBN:
9780079039897
Author:
Carter
Publisher:
McGraw Hill
Big Ideas Math A Bridge To Success Algebra 1: Stu…
Algebra
ISBN:
9781680331141
Author:
HOUGHTON MIFFLIN HARCOURT
Publisher:
Houghton Mifflin Harcourt