The given data represent the number of people from a town, aged 25-64, who subscribe to a certain print magazine. Construct a frequency polygon. Does the graph suggest that the distribution is skewed? If so, how? Construct a frequency polygon using the data. Choose the correct graph below. O A. 1000- Frequency 04 19.5 Age 69.5 Q O B. 1000- Frequency 25 Age 65 Does the graph suggest that the distribution is skewed? If so, how? O A. The distribution appears to be skewed to both sides. Q C O C. 1000- 0- Frequency 25 Age 65 Q Age 25-34 35-44 45-54 55-64 O D. People 618 744 105 63 1000- Frequency 04 19.5 Age 69.5
The given data represent the number of people from a town, aged 25-64, who subscribe to a certain print magazine. Construct a frequency polygon. Does the graph suggest that the distribution is skewed? If so, how? Construct a frequency polygon using the data. Choose the correct graph below. O A. 1000- Frequency 04 19.5 Age 69.5 Q O B. 1000- Frequency 25 Age 65 Does the graph suggest that the distribution is skewed? If so, how? O A. The distribution appears to be skewed to both sides. Q C O C. 1000- 0- Frequency 25 Age 65 Q Age 25-34 35-44 45-54 55-64 O D. People 618 744 105 63 1000- Frequency 04 19.5 Age 69.5

Managerial Economics: Applications, Strategies and Tactics (MindTap Course List)
14th Edition
ISBN:9781305506381
Author:James R. McGuigan, R. Charles Moyer, Frederick H.deB. Harris
Publisher:James R. McGuigan, R. Charles Moyer, Frederick H.deB. Harris
Chapter4A: Problems In Applying The Linear Regression Model
Section: Chapter Questions
Problem 5E

Related questions
Question
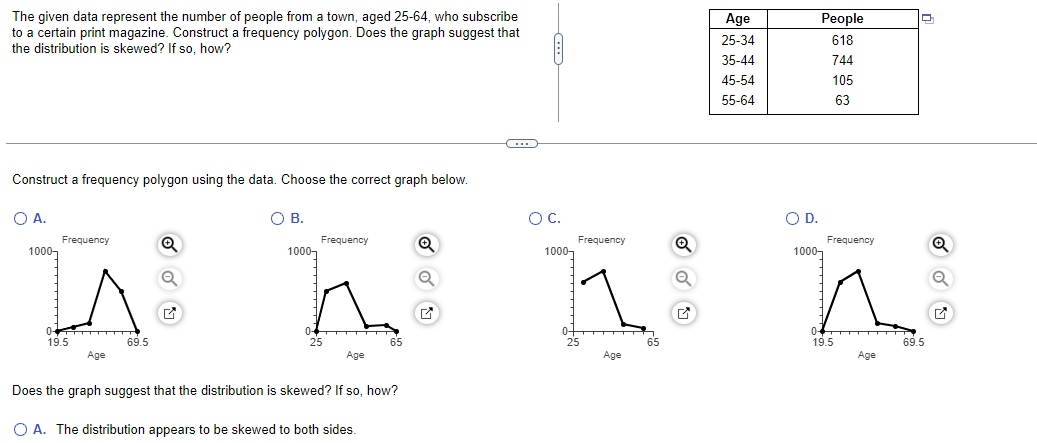
Transcribed Image Text:The given data represent the number of people from a town, aged 25-64, who subscribe
to a certain print magazine. Construct a frequency polygon. Does the graph suggest that
the distribution is skewed? If so, how?
Construct a frequency polygon using the data. Choose the correct graph below.
O A.
1000-
Frequency
04
19.5
Age
69.5
Q
O B.
1000-
Frequency
25
Age
65
Does the graph suggest that the distribution is skewed? If so, how?
O A. The distribution appears to be skewed to both sides.
Q
C
O C.
1000-
0-
Frequency
25
Age
65
Q
Age
25-34
35-44
45-54
55-64
O D.
People
618
744
105
63
1000-
Frequency
04
19.5
Age
69.5
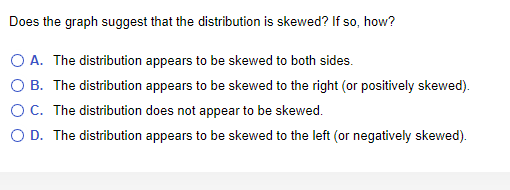
Transcribed Image Text:Does the graph suggest that the distribution is skewed? If so, how?
O A. The distribution appears to be skewed to both sides.
O B. The distribution appears to be skewed to the right (or positively skewed).
O C. The distribution does not appear to be skewed.
O D. The distribution appears to be skewed to the left (or negatively skewed).
Expert Solution
This question has been solved!
Explore an expertly crafted, step-by-step solution for a thorough understanding of key concepts.

Step by step
Solved in 2 steps

Knowledge Booster


Learn more about
Need a deep-dive on the concept behind this application? Look no further. Learn more about this topic, economics and related others by exploring similar questions and additional content below.Recommended textbooks for you
Managerial Economics: Applications, Strategies an…
Economics
ISBN:
9781305506381
Author:
James R. McGuigan, R. Charles Moyer, Frederick H.deB. Harris
Publisher:
Cengage Learning

Managerial Economics: Applications, Strategies an…
Economics
ISBN:
9781305506381
Author:
James R. McGuigan, R. Charles Moyer, Frederick H.deB. Harris
Publisher:
Cengage Learning