The given data represents a frequency distribution of the F-scale intensities of recent tornadoes. Use the frequency distribution to construct a frequency polygon. Does the graph suggest that the distribution is skewed? If so, how? Tornado F-Scale Frequency 24 18 4. Construct a frequency polygon using the data. Choose the correct graph below. OA. O B Oc. OD. Frequency 30- Frequency 30- Frequency 30- Frequency 30- F-Scale F-Scale F-Scale F-Scale Does the graph suggest that the distribution is skewed? If so, how? O A. The distribution appears to be skewed to the left (or negatively skewed). O B. The distribution appears to be skewed to the right (or positively skewed). O C. The distribution does not appear to be skewed. O D. The distribution appears to be skewed to both sides. O Time Remaining: 00:32:52 MacBook Pro
The given data represents a frequency distribution of the F-scale intensities of recent tornadoes. Use the frequency distribution to construct a frequency polygon. Does the graph suggest that the distribution is skewed? If so, how? Tornado F-Scale Frequency 24 18 4. Construct a frequency polygon using the data. Choose the correct graph below. OA. O B Oc. OD. Frequency 30- Frequency 30- Frequency 30- Frequency 30- F-Scale F-Scale F-Scale F-Scale Does the graph suggest that the distribution is skewed? If so, how? O A. The distribution appears to be skewed to the left (or negatively skewed). O B. The distribution appears to be skewed to the right (or positively skewed). O C. The distribution does not appear to be skewed. O D. The distribution appears to be skewed to both sides. O Time Remaining: 00:32:52 MacBook Pro

Glencoe Algebra 1, Student Edition, 9780079039897, 0079039898, 2018
18th Edition
ISBN:9780079039897
Author:Carter
Publisher:Carter
Chapter10: Statistics
Section10.6: Summarizing Categorical Data
Problem 23PPS

Related questions
Question
100%
Hi I need help with part A and B please
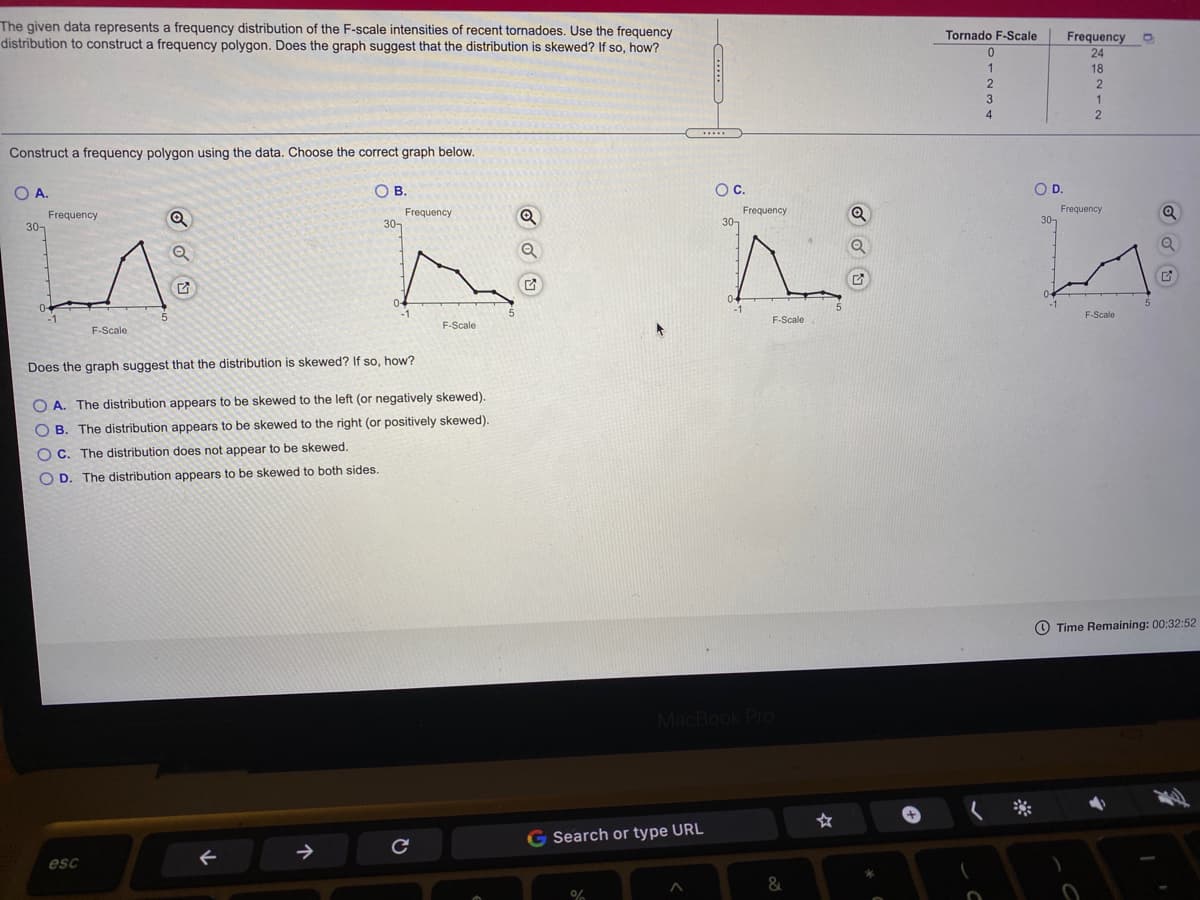
Transcribed Image Text:The given data represents a frequency distribution of the F-scale intensities of recent tornadoes. Use the frequency
distribution to construct a frequency polygon. Does the graph suggest that the distribution is skewed? If so, how?
Tornado F-Scale
Frequency
24
18
1
2
.....
Construct a frequency polygon using the data. Choose the correct graph below.
OA.
O A.
O B
Oc.
OD.
Frequency
30-
Frequency
30-
Frequency
30-
Frequency
30,
04
-1
-1
-1
F-Scale
-1
F-Scale
F-Scale
F-Scale
Does the graph suggest that the distribution is skewed? If so, how?
O A. The distribution appears to be skewed to the left (or negatively skewed).
O B.
The distribution appears to be skewed to the right (or positively skewed).
O C. The distribution does not appear to be skewed.
O D. The distribution appears to be skewed to both sides.
O Time Remaining: 00:32:52
MacBook Pro
く *
G Search or type URL
esc
1234
Expert Solution
This question has been solved!
Explore an expertly crafted, step-by-step solution for a thorough understanding of key concepts.

This is a popular solution!

Trending now
This is a popular solution!

Step by step
Solved in 2 steps with 2 images

Recommended textbooks for you
Glencoe Algebra 1, Student Edition, 9780079039897…
Algebra
ISBN:
9780079039897
Author:
Carter
Publisher:
McGraw Hill

Big Ideas Math A Bridge To Success Algebra 1: Stu…
Algebra
ISBN:
9781680331141
Author:
HOUGHTON MIFFLIN HARCOURT
Publisher:
Houghton Mifflin Harcourt

Holt Mcdougal Larson Pre-algebra: Student Edition…
Algebra
ISBN:
9780547587776
Author:
HOLT MCDOUGAL
Publisher:
HOLT MCDOUGAL
Glencoe Algebra 1, Student Edition, 9780079039897…
Algebra
ISBN:
9780079039897
Author:
Carter
Publisher:
McGraw Hill
Big Ideas Math A Bridge To Success Algebra 1: Stu…
Algebra
ISBN:
9781680331141
Author:
HOUGHTON MIFFLIN HARCOURT
Publisher:
Houghton Mifflin Harcourt
Holt Mcdougal Larson Pre-algebra: Student Edition…
Algebra
ISBN:
9780547587776
Author:
HOLT MCDOUGAL
Publisher:
HOLT MCDOUGAL