The given data represents a frequency distribution of the F-scale intensities of recent tornadoes. Use the frequency distribution to construct a frequency polygon. Does the graph suggest that the distribution skewed? If so, how? Construct a frequency polygon using the data. Choose the correct graph below. O A. Frequency ñ -1 F-Scale Q ✔ Does the graph suggest that the distribution is skewed? If so, how? O B. Frequency 30- M F-Scale O A. The distribution does not appear to be skewed. OB. The distribution appears to be skewed to the right (or positively skewed). O C. The distribution appears to be skewed to both sides. OD. The distribution appears to be skewed to the left (or negatively skewed). Q Q C OC. Frequency 30- In F-Scale Q Tornado F-Scale Frequency 25 16 .1 3 O D. Frequency Q 30- LA Q F-Scale
The given data represents a frequency distribution of the F-scale intensities of recent tornadoes. Use the frequency distribution to construct a frequency polygon. Does the graph suggest that the distribution skewed? If so, how? Construct a frequency polygon using the data. Choose the correct graph below. O A. Frequency ñ -1 F-Scale Q ✔ Does the graph suggest that the distribution is skewed? If so, how? O B. Frequency 30- M F-Scale O A. The distribution does not appear to be skewed. OB. The distribution appears to be skewed to the right (or positively skewed). O C. The distribution appears to be skewed to both sides. OD. The distribution appears to be skewed to the left (or negatively skewed). Q Q C OC. Frequency 30- In F-Scale Q Tornado F-Scale Frequency 25 16 .1 3 O D. Frequency Q 30- LA Q F-Scale

Glencoe Algebra 1, Student Edition, 9780079039897, 0079039898, 2018
18th Edition
ISBN:9780079039897
Author:Carter
Publisher:Carter
Chapter4: Equations Of Linear Functions
Section4.4: Scatter Plots And Line Of Fit
Problem 1GP

Related questions
Question
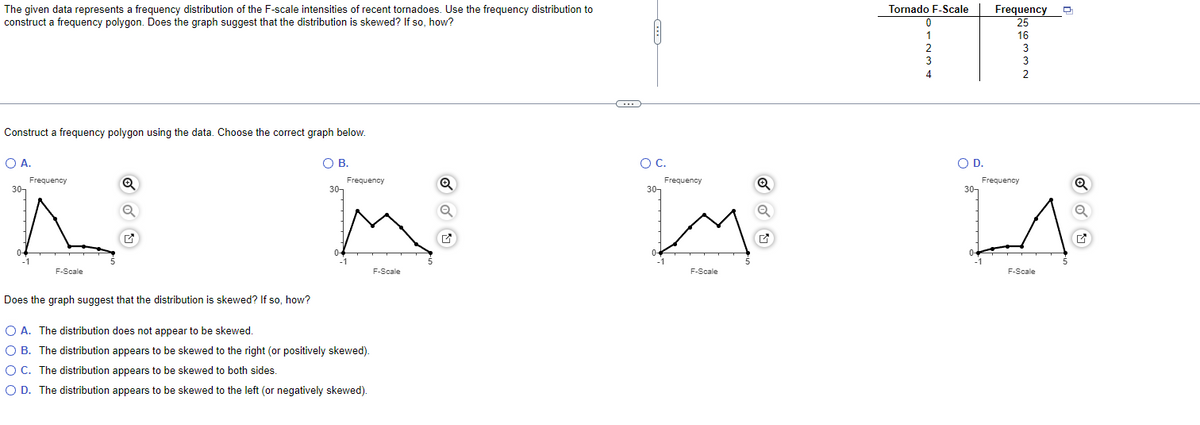
Transcribed Image Text:The given data represents a frequency distribution of the F-scale intensities of recent tornadoes. Use the frequency distribution to
construct a frequency polygon. Does the graph suggest that the distribution is skewed? If so, how?
Construct a frequency polygon using the data. Choose the correct graph below.
OA.
Frequency
30-
^
F-Scale
Q
OB.
30-
Frequency
Does the graph suggest that the distribution skewed? If so, how?
O A. The distribution does not appear to be skewed.
O B. The distribution appears to be skewed to the right (or positively skewed).
O C. The distribution appears to be skewed to both sides.
O D. The distribution appears to be skewed to the left (or negatively skewed).
F-Scale
Q
G
O C.
30-
Frequency
F-Scale
Q
Tornado F-Scale
4
Frequency
25
16
O D.
Frequency
30-
I
F-Scale
Q
Q
Expert Solution
This question has been solved!
Explore an expertly crafted, step-by-step solution for a thorough understanding of key concepts.

This is a popular solution!

Trending now
This is a popular solution!

Step by step
Solved in 3 steps with 2 images

Recommended textbooks for you
Glencoe Algebra 1, Student Edition, 9780079039897…
Algebra
ISBN:
9780079039897
Author:
Carter
Publisher:
McGraw Hill

Holt Mcdougal Larson Pre-algebra: Student Edition…
Algebra
ISBN:
9780547587776
Author:
HOLT MCDOUGAL
Publisher:
HOLT MCDOUGAL

Algebra: Structure And Method, Book 1
Algebra
ISBN:
9780395977224
Author:
Richard G. Brown, Mary P. Dolciani, Robert H. Sorgenfrey, William L. Cole
Publisher:
McDougal Littell
Glencoe Algebra 1, Student Edition, 9780079039897…
Algebra
ISBN:
9780079039897
Author:
Carter
Publisher:
McGraw Hill
Holt Mcdougal Larson Pre-algebra: Student Edition…
Algebra
ISBN:
9780547587776
Author:
HOLT MCDOUGAL
Publisher:
HOLT MCDOUGAL
Algebra: Structure And Method, Book 1
Algebra
ISBN:
9780395977224
Author:
Richard G. Brown, Mary P. Dolciani, Robert H. Sorgenfrey, William L. Cole
Publisher:
McDougal Littell

College Algebra (MindTap Course List)
Algebra
ISBN:
9781305652231
Author:
R. David Gustafson, Jeff Hughes
Publisher:
Cengage Learning