The grades for 30 students on the most recent exam are given in the data table below: 90 60 60 80 90 60 60 80 90 90 80 80 70 80 60 60 80 70 90 90 70 80 Create a frequency distribution table to help you organize the data, and then calculate the following: Round your answers to 2 decimal places as needed What is the median score for the exam? Median = What is the mean score for the exam? X = What is the standard deviation for the exam? S = What is the interval that would contain all of the scores that lie within one standard deviation of the mean? 88888 90 60 60 70 90 188 818 70 I607元 7元
The grades for 30 students on the most recent exam are given in the data table below: 90 60 60 80 90 60 60 80 90 90 80 80 70 80 60 60 80 70 90 90 70 80 Create a frequency distribution table to help you organize the data, and then calculate the following: Round your answers to 2 decimal places as needed What is the median score for the exam? Median = What is the mean score for the exam? X = What is the standard deviation for the exam? S = What is the interval that would contain all of the scores that lie within one standard deviation of the mean? 88888 90 60 60 70 90 188 818 70 I607元 7元

Glencoe Algebra 1, Student Edition, 9780079039897, 0079039898, 2018
18th Edition
ISBN:9780079039897
Author:Carter
Publisher:Carter
Chapter10: Statistics
Section10.4: Distributions Of Data
Problem 19PFA

Related questions
Question
I would enjoy the help.
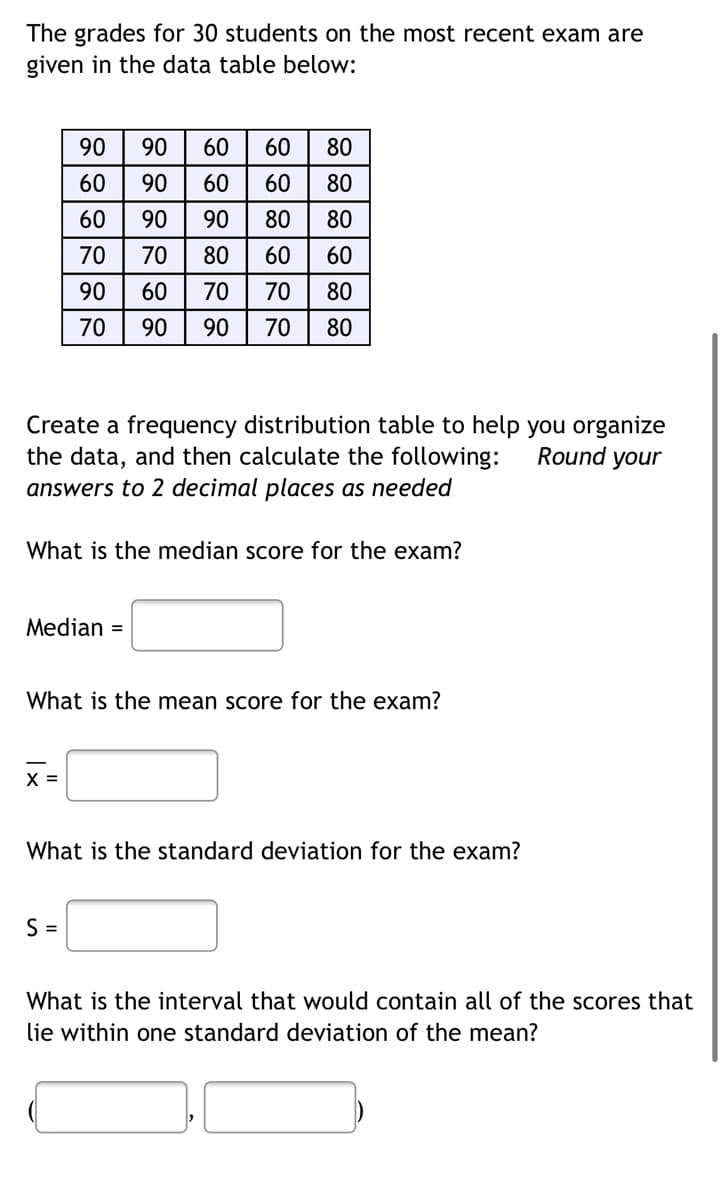
Transcribed Image Text:The grades for 30 students on the most recent exam are
given in the data table below:
60 80
60 80
80
80
60
70 80
70 80
Create a frequency distribution table to help you organize
the data, and then calculate the following:
Round your
answers to 2 decimal places as needed
What is the median score for the exam?
Median =
What is the mean score for the exam?
X =
What is the standard deviation for the exam?
S=
What is the interval that would contain all of the scores that
lie within one standard deviation of the mean?
BOERER
888888
888888
8888
90
60
60
70
90
70
90
90
90
70
60
90
60
60
90
80
70
90
60
Expert Solution
This question has been solved!
Explore an expertly crafted, step-by-step solution for a thorough understanding of key concepts.

This is a popular solution!

Trending now
This is a popular solution!

Step by step
Solved in 6 steps with 6 images

Recommended textbooks for you
Glencoe Algebra 1, Student Edition, 9780079039897…
Algebra
ISBN:
9780079039897
Author:
Carter
Publisher:
McGraw Hill
Glencoe Algebra 1, Student Edition, 9780079039897…
Algebra
ISBN:
9780079039897
Author:
Carter
Publisher:
McGraw Hill