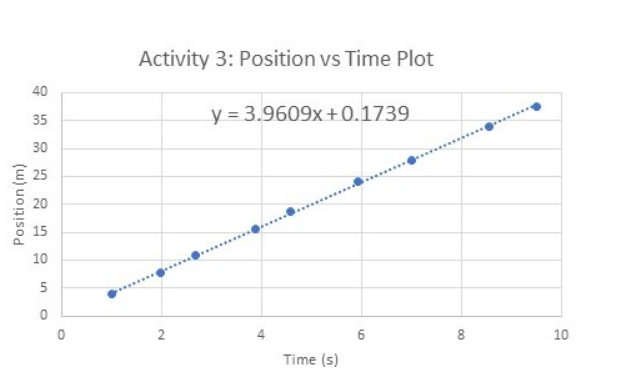
The graph above represents the data from Activity 3 in this week's lab describing the position of a moving cart as a function of time. The equation for the best-fit line for this position vs. time graph is y = 3.9609x + 0.1739. What is the speed of the cart? [All the quantities are measured in standard units. Do not include units in your answer.]
The graph above represents the data from Activity 3 in this week's lab describing the position of a moving cart as a function of time. The equation for the best-fit line for this position vs. time graph is y = 3.9609x + 0.1739. What is the speed of the cart? [All the quantities are measured in standard units. Do not include units in your answer.]

Physics for Scientists and Engineers, Technology Update (No access codes included)
9th Edition
ISBN:9781305116399
Author:Raymond A. Serway, John W. Jewett
Publisher:Raymond A. Serway, John W. Jewett
Chapter1: Physics And Measurement
Section: Chapter Questions
Problem 1.6OQ

Related questions

Question
The graph above represents the data from Activity 3 in this week's lab describing the position of a moving cart as a function of time. The equation for the best-fit line for this position vs. time graph is y = 3.9609x + 0.1739. What is the speed of the cart? [All the quantities are measured in standard units. Do not include units in your answer.]
Transcribed Image Text:40
35
30
€ 25
20
Position (m)
15
10
5
O
Activity 3: Position vs Time Plot
2
y = 3.9609x+0.1739
Time (s)
6
8
10
Expert Solution
This question has been solved!
Explore an expertly crafted, step-by-step solution for a thorough understanding of key concepts.

This is a popular solution!

Trending now
This is a popular solution!

Step by step
Solved in 4 steps

Knowledge Booster


Learn more about
Need a deep-dive on the concept behind this application? Look no further. Learn more about this topic, physics and related others by exploring similar questions and additional content below.Recommended textbooks for you
Physics for Scientists and Engineers, Technology …
Physics
ISBN:
9781305116399
Author:
Raymond A. Serway, John W. Jewett
Publisher:
Cengage Learning

College Physics
Physics
ISBN:
9781285737027
Author:
Raymond A. Serway, Chris Vuille
Publisher:
Cengage Learning
Physics for Scientists and Engineers, Technology …
Physics
ISBN:
9781305116399
Author:
Raymond A. Serway, John W. Jewett
Publisher:
Cengage Learning
College Physics
Physics
ISBN:
9781285737027
Author:
Raymond A. Serway, Chris Vuille
Publisher:
Cengage Learning