The graph below depicts the demand curve facing a monopolist. The monopoly has constant marginal costs of $5. On the graph: A). Use the straight line tool to draw the marginal revenue curve. B) use the straight line tool to draw the marginal cost curve up to 60 units of output C) use the point tool to plot the profit maximization point on the demand curve
The graph below depicts the demand curve facing a monopolist. The monopoly has constant marginal costs of $5. On the graph: A). Use the straight line tool to draw the marginal revenue curve. B) use the straight line tool to draw the marginal cost curve up to 60 units of output C) use the point tool to plot the profit maximization point on the demand curve

Managerial Economics: A Problem Solving Approach
5th Edition
ISBN:9781337106665
Author:Luke M. Froeb, Brian T. McCann, Michael R. Ward, Mike Shor
Publisher:Luke M. Froeb, Brian T. McCann, Michael R. Ward, Mike Shor
Chapter20: The Problem Of Adverse Selection Moral Hazard
Section: Chapter Questions
Problem 3MC

Related questions
Question
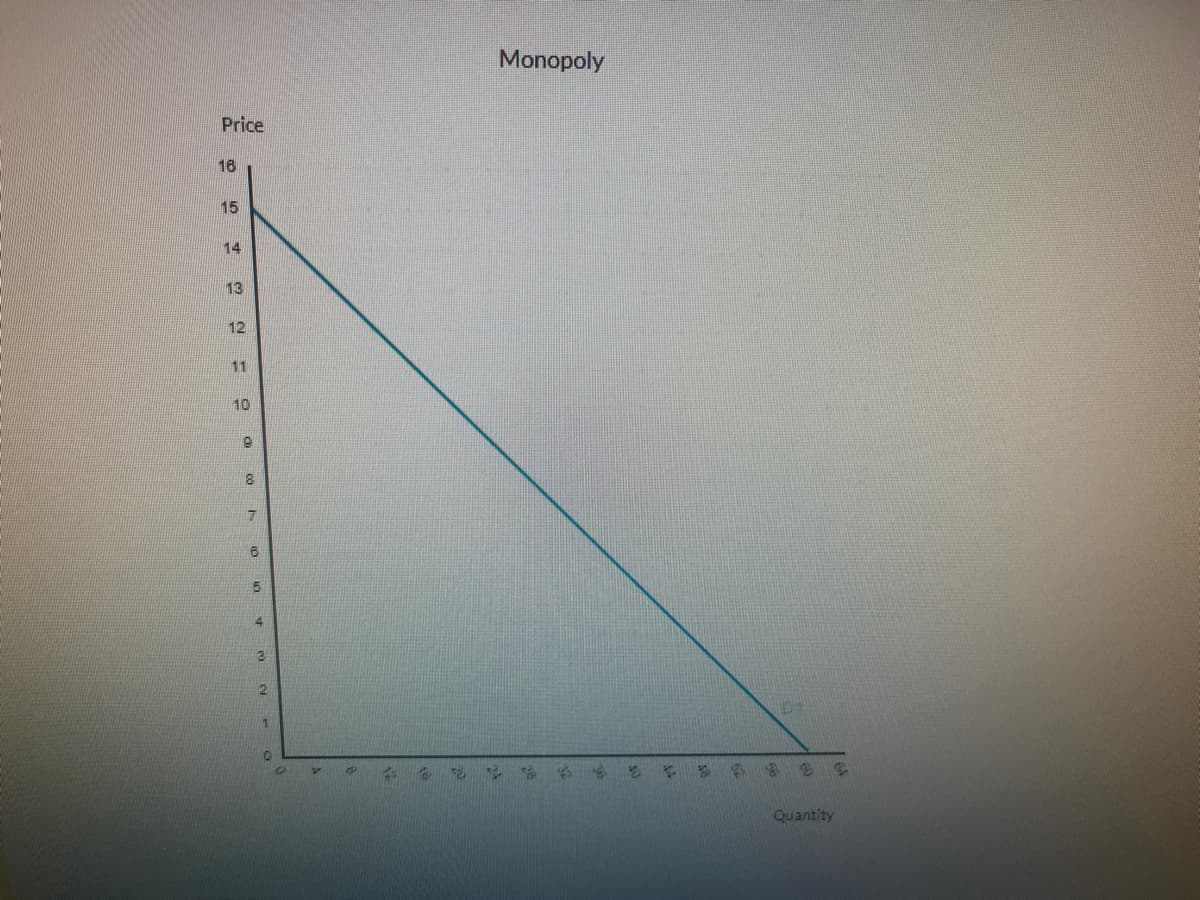
The graph below depicts the demand curve facing a monopolist. The monopoly has constant marginal costs of $5. On the graph:
A). Use the straight line tool to draw the marginal revenue curve.
B) use the straight line tool to draw the marginal cost curve up to 60 units of output
C) use the point tool to plot the profit maximization point on the demand curve.
Transcribed Image Text:Price
.
8
7
6
2
NN-
V
O
20
Monopoly
To To
F 5 4
2
B
P
Quantity
Expert Solution
This question has been solved!
Explore an expertly crafted, step-by-step solution for a thorough understanding of key concepts.

This is a popular solution!

Trending now
This is a popular solution!

Step by step
Solved in 2 steps with 1 images

Knowledge Booster


Learn more about
Need a deep-dive on the concept behind this application? Look no further. Learn more about this topic, economics and related others by exploring similar questions and additional content below.Recommended textbooks for you
Managerial Economics: A Problem Solving Approach
Economics
ISBN:
9781337106665
Author:
Luke M. Froeb, Brian T. McCann, Michael R. Ward, Mike Shor
Publisher:
Cengage Learning
Managerial Economics: A Problem Solving Approach
Economics
ISBN:
9781337106665
Author:
Luke M. Froeb, Brian T. McCann, Michael R. Ward, Mike Shor
Publisher:
Cengage Learning