The graph below shows cost curves for a perfectly competitive firm. Price/Cost $50 $40 $30 $20 $10 10 20 30 Quantity MC 40 ATC AVC 50 At a price of $10, how many units will this firm produce if its goal is to maximize profit?
The graph below shows cost curves for a perfectly competitive firm. Price/Cost $50 $40 $30 $20 $10 10 20 30 Quantity MC 40 ATC AVC 50 At a price of $10, how many units will this firm produce if its goal is to maximize profit?

Principles of Economics 2e
2nd Edition
ISBN:9781947172364
Author:Steven A. Greenlaw; David Shapiro
Publisher:Steven A. Greenlaw; David Shapiro
Chapter8: Perfect Competition
Section: Chapter Questions
Problem 36CTQ: Why will losses for firms in a perfectly competitive industry tend to vanish in the long run?

Related questions
Question
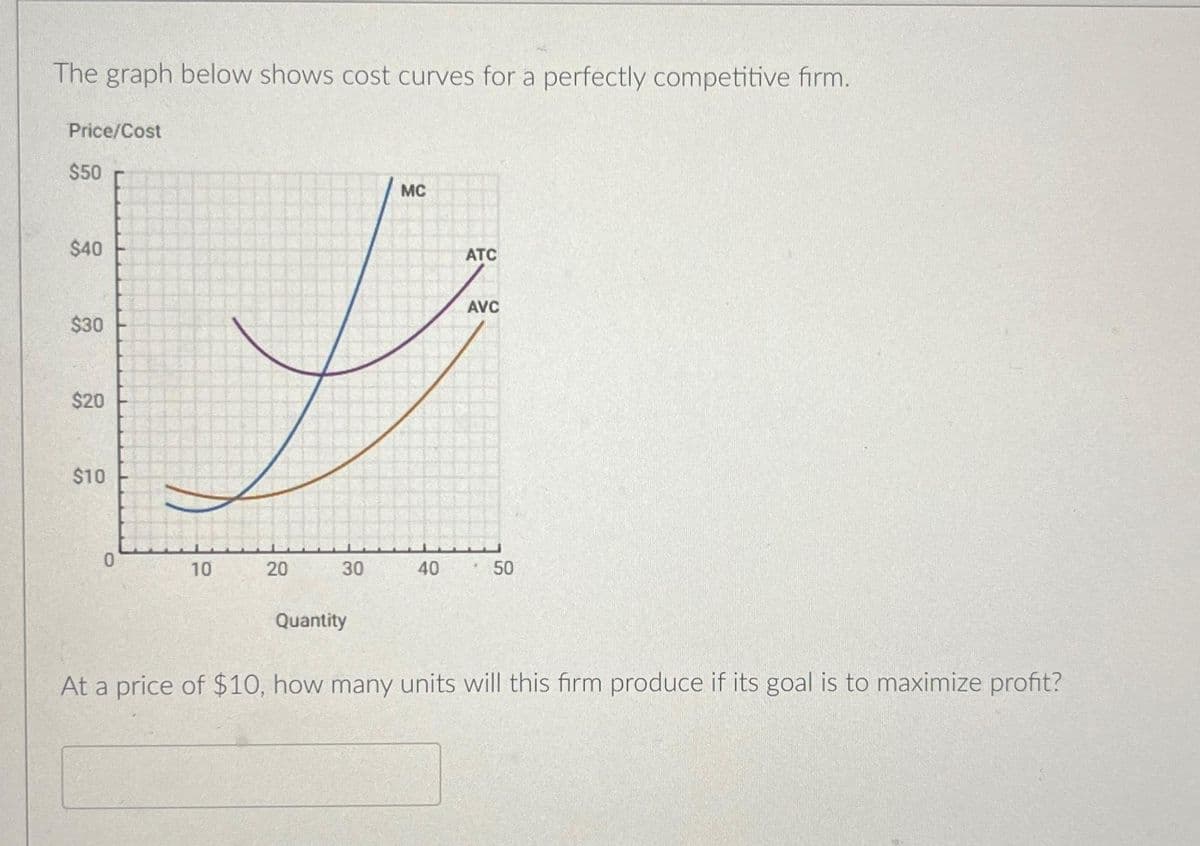
Transcribed Image Text:The graph below shows cost curves for a perfectly competitive firm.
Price/Cost
$50
$40
$30
$20
$10
0
10
20
30
Quantity
MC
40
ATC
AVC
50
At a price of $10, how many units will this firm produce if its goal is to maximize profit?
Expert Solution
This question has been solved!
Explore an expertly crafted, step-by-step solution for a thorough understanding of key concepts.

Step by step
Solved in 3 steps with 1 images

Knowledge Booster


Learn more about
Need a deep-dive on the concept behind this application? Look no further. Learn more about this topic, economics and related others by exploring similar questions and additional content below.Recommended textbooks for you
Principles of Economics 2e
Economics
ISBN:
9781947172364
Author:
Steven A. Greenlaw; David Shapiro
Publisher:
OpenStax


Economics (MindTap Course List)
Economics
ISBN:
9781337617383
Author:
Roger A. Arnold
Publisher:
Cengage Learning
Principles of Economics 2e
Economics
ISBN:
9781947172364
Author:
Steven A. Greenlaw; David Shapiro
Publisher:
OpenStax
Economics (MindTap Course List)
Economics
ISBN:
9781337617383
Author:
Roger A. Arnold
Publisher:
Cengage Learning


