70 60 ATC 50 40 30 20 AVC MC O 10 5 10 15 20 25 30 35 40 45 50 (Thousands of jackets) ANT each price in the following table, use the graph to determine the number of jackets this firm would produce in order to maximize its profit. Assume when the price is exactly equal to the average variable cost, the firm is indifferent between producing zero jackets and the profit-maximizing tity. Also, indicate whether the firm will produce, shut down, or be indifferent between the two in the short run. Lastly, determine whether it will e a profit, suffer a loss, or break even at each price. Price Quantity ollars per jacket) (Jackets) Produce or Shut Down? Profit or Loss? Shut down Shut down 10 20,000 Loss 20 10,000 Loss 32 5,000 Shut down Loss 40 Either 0 or 37,500 Produce Loss 50 40,000 Produce Loss 60 Either 0 or 42,500 Produce Loss COSTS (Dollars)
70 60 ATC 50 40 30 20 AVC MC O 10 5 10 15 20 25 30 35 40 45 50 (Thousands of jackets) ANT each price in the following table, use the graph to determine the number of jackets this firm would produce in order to maximize its profit. Assume when the price is exactly equal to the average variable cost, the firm is indifferent between producing zero jackets and the profit-maximizing tity. Also, indicate whether the firm will produce, shut down, or be indifferent between the two in the short run. Lastly, determine whether it will e a profit, suffer a loss, or break even at each price. Price Quantity ollars per jacket) (Jackets) Produce or Shut Down? Profit or Loss? Shut down Shut down 10 20,000 Loss 20 10,000 Loss 32 5,000 Shut down Loss 40 Either 0 or 37,500 Produce Loss 50 40,000 Produce Loss 60 Either 0 or 42,500 Produce Loss COSTS (Dollars)

Essentials of Economics (MindTap Course List)
8th Edition
ISBN:9781337091992
Author:N. Gregory Mankiw
Publisher:N. Gregory Mankiw
Chapter12: The Cost Of Production
Section: Chapter Questions
Problem 3PA

Related questions
Question
100%
Consider the
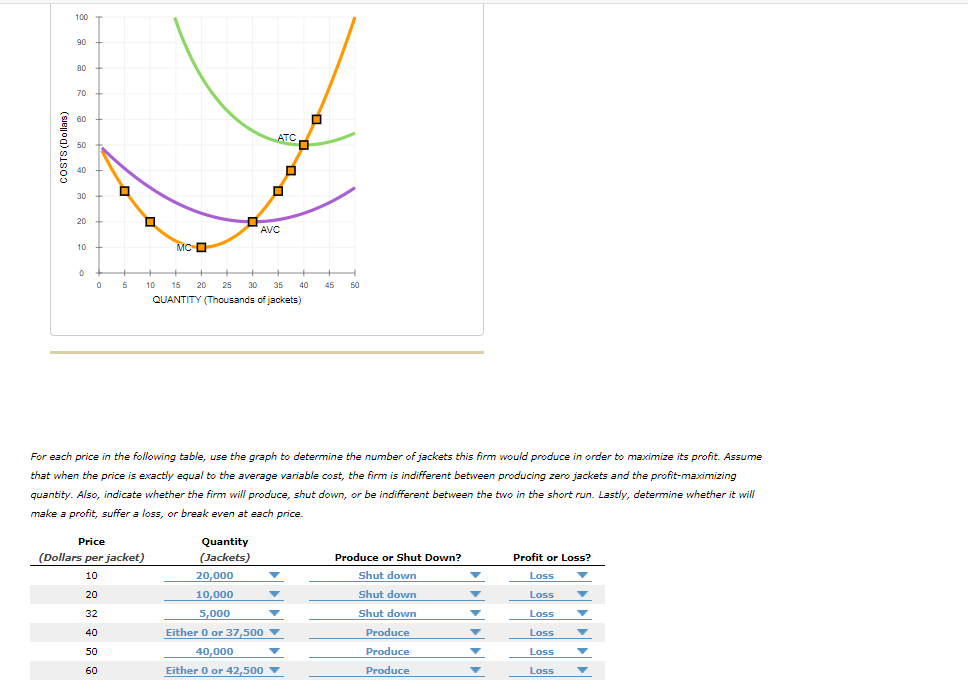
Transcribed Image Text:100
90
80
70
60
ATC
50
40
30
20
AVC
10
MCO
5
10
15
20 25
30
35
40
45
50
QUANTITY (Thousands of jackets)
For each price in the following table, use the graph to determine the number of jackets this firm would produce in order to maximize its profit. Assume
that when the price is exactly equal to the average variable cost, the firm is indifferent between producing zero jackets and the profit-maximizing
quantity. Also, indicate whether the firm will produce, shut down, or be indifferent between the two in the short run. Lastly, determine whether it will
make a profit, suffer a loss, or break even at each price.
Price
Quantity
(Dollars per jacket)
(Jackets)
Produce or Shut Down?
Profit or Loss?
10
20,000
Shut down
Loss
Shut down
20
10,000
Loss
32
5,000
Shut down
Loss
40
Either 0 or 37,500 v
Produce
Loss
50
40,000
Produce
Loss
60
Either 0 or 42,500 V
Produce
Loss
(siejjog) siso
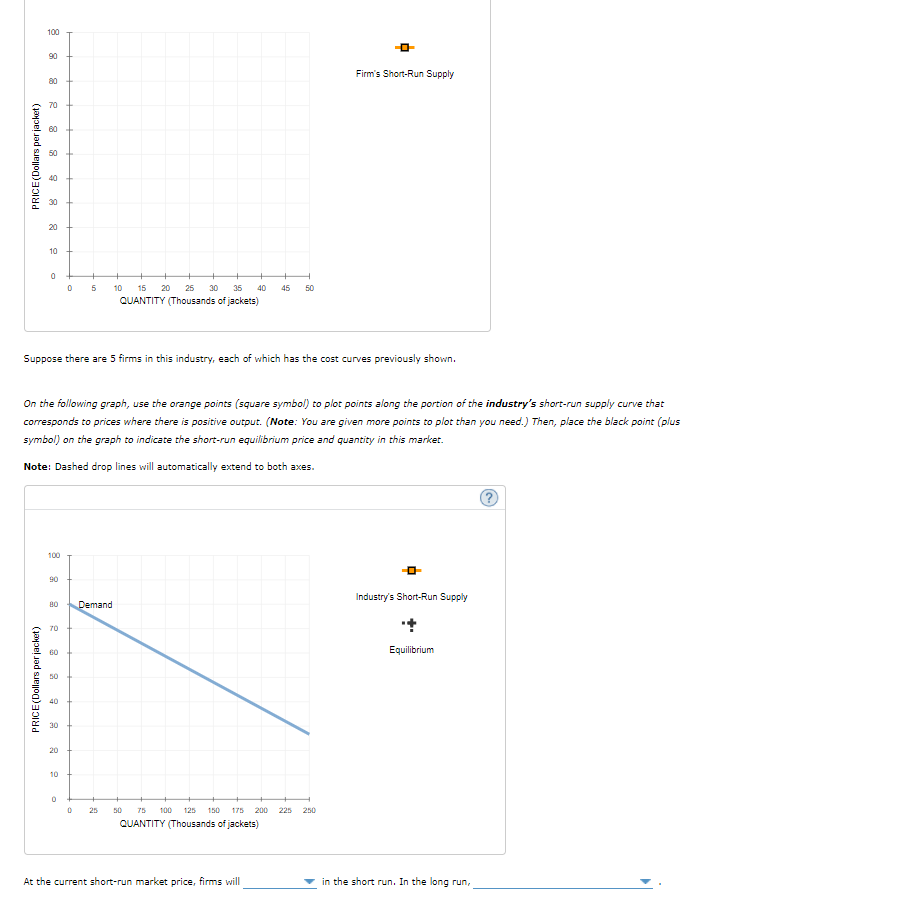
Transcribed Image Text:100
90
Firm's Short-Run Supply
80
70
60
50 +
40
30
20
10
5
10
15
20 25
30
35
40
45
50
QUANTITY (Thousands of jackets)
Suppose there are 5 firms in this industry, each of which has the cost curves previously shown.
On the following graph, use the orange points (square symbol) to plot points along the portion of the industry's short-run supply curve that
corresponds to prices where there is positive output. (Note: You are given more points to plot than you need.) Then, place the black point (plus
symbol) on the graph to indicate the short-run equilibrium price and quantity in this market.
Note: Dashed drop lines will automatically extend to both axes.
100
90
Industry's Short-Run Supply
Demand
70
60
Equilibrium
50
40
30
20
10
25
50
75
100
125
150
175
200
225
250
QUANTITY (Thousands of jackets)
At the current short-run market price, firms will
in the short run. In the long run,
PRICE(Dollars per jacket)
PRICE(Dollars per jacket)
Expert Solution
This question has been solved!
Explore an expertly crafted, step-by-step solution for a thorough understanding of key concepts.

This is a popular solution!

Trending now
This is a popular solution!

Step by step
Solved in 3 steps with 2 images

Knowledge Booster


Learn more about
Need a deep-dive on the concept behind this application? Look no further. Learn more about this topic, economics and related others by exploring similar questions and additional content below.Recommended textbooks for you
Essentials of Economics (MindTap Course List)
Economics
ISBN:
9781337091992
Author:
N. Gregory Mankiw
Publisher:
Cengage Learning

Managerial Economics: A Problem Solving Approach
Economics
ISBN:
9781337106665
Author:
Luke M. Froeb, Brian T. McCann, Michael R. Ward, Mike Shor
Publisher:
Cengage Learning

Principles of Economics (MindTap Course List)
Economics
ISBN:
9781305585126
Author:
N. Gregory Mankiw
Publisher:
Cengage Learning
Essentials of Economics (MindTap Course List)
Economics
ISBN:
9781337091992
Author:
N. Gregory Mankiw
Publisher:
Cengage Learning
Managerial Economics: A Problem Solving Approach
Economics
ISBN:
9781337106665
Author:
Luke M. Froeb, Brian T. McCann, Michael R. Ward, Mike Shor
Publisher:
Cengage Learning
Principles of Economics (MindTap Course List)
Economics
ISBN:
9781305585126
Author:
N. Gregory Mankiw
Publisher:
Cengage Learning

Principles of Economics, 7th Edition (MindTap Cou…
Economics
ISBN:
9781285165875
Author:
N. Gregory Mankiw
Publisher:
Cengage Learning

Principles of Economics 2e
Economics
ISBN:
9781947172364
Author:
Steven A. Greenlaw; David Shapiro
Publisher:
OpenStax
