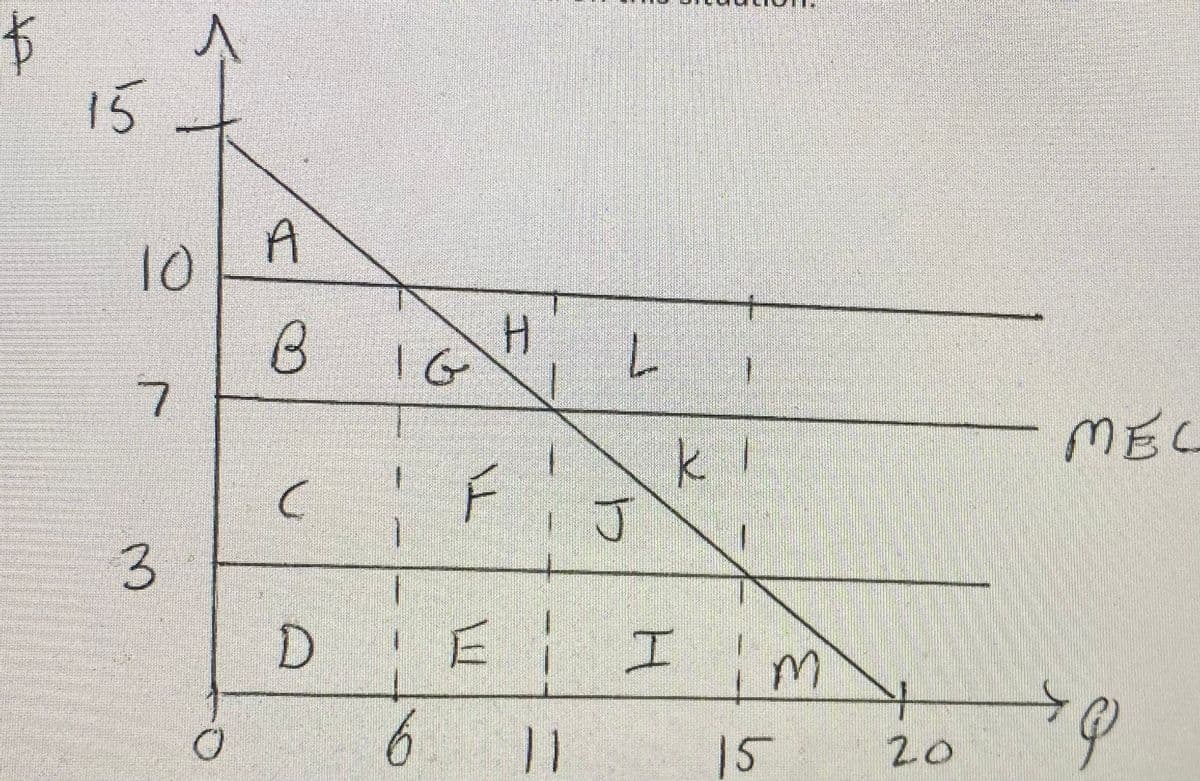
The graph directly below depicts the production of oil from the Gulf of Mexico, with market demand, MEC, MSC, and MPC all drawn on the figure. The X axis defines barrels of oil pumped from the gulf. A. Suppose this market is unregulated. How much lower is the market price compared to the price at the socially optimal outcome? a. 3 b. 4 c. 7 d. None of the above B. What should a tax on barrels of oil drilled be set equal to in this problem to "correct" the market? a. 10 b. 7 c. 3 d. None of the above
The graph directly below depicts the production of oil from the Gulf of Mexico, with market demand, MEC, MSC, and MPC all drawn on the figure. The X axis defines barrels of oil pumped from the gulf. A. Suppose this market is unregulated. How much lower is the market price compared to the price at the socially optimal outcome? a. 3 b. 4 c. 7 d. None of the above B. What should a tax on barrels of oil drilled be set equal to in this problem to "correct" the market? a. 10 b. 7 c. 3 d. None of the above

Principles of Economics 2e
2nd Edition
ISBN:9781947172364
Author:Steven A. Greenlaw; David Shapiro
Publisher:Steven A. Greenlaw; David Shapiro
Chapter22: Inflation
Section: Chapter Questions
Problem 18RQ: What is deflation?

Related questions
Question
100%
The graph directly below depicts the production of oil from the Gulf of Mexico, with market
A. Suppose this market is unregulated. How much lower is the market
a. 3
b. 4
c. 7
d. None of the above
B. What should a tax on barrels of oil drilled be set equal to in this problem to "correct" the market?
a. 10
b. 7
c. 3
d. None of the above
Transcribed Image Text:$
15
10
7
^
3
A
B
C
D
IG
6
I
F
ㅠㅠ
11
L 1
KI
J
I im
15
20
MEC
Expert Solution
This question has been solved!
Explore an expertly crafted, step-by-step solution for a thorough understanding of key concepts.

This is a popular solution!

Trending now
This is a popular solution!

Step by step
Solved in 2 steps

Recommended textbooks for you
Principles of Economics 2e
Economics
ISBN:
9781947172364
Author:
Steven A. Greenlaw; David Shapiro
Publisher:
OpenStax
Principles of Economics 2e
Economics
ISBN:
9781947172364
Author:
Steven A. Greenlaw; David Shapiro
Publisher:
OpenStax