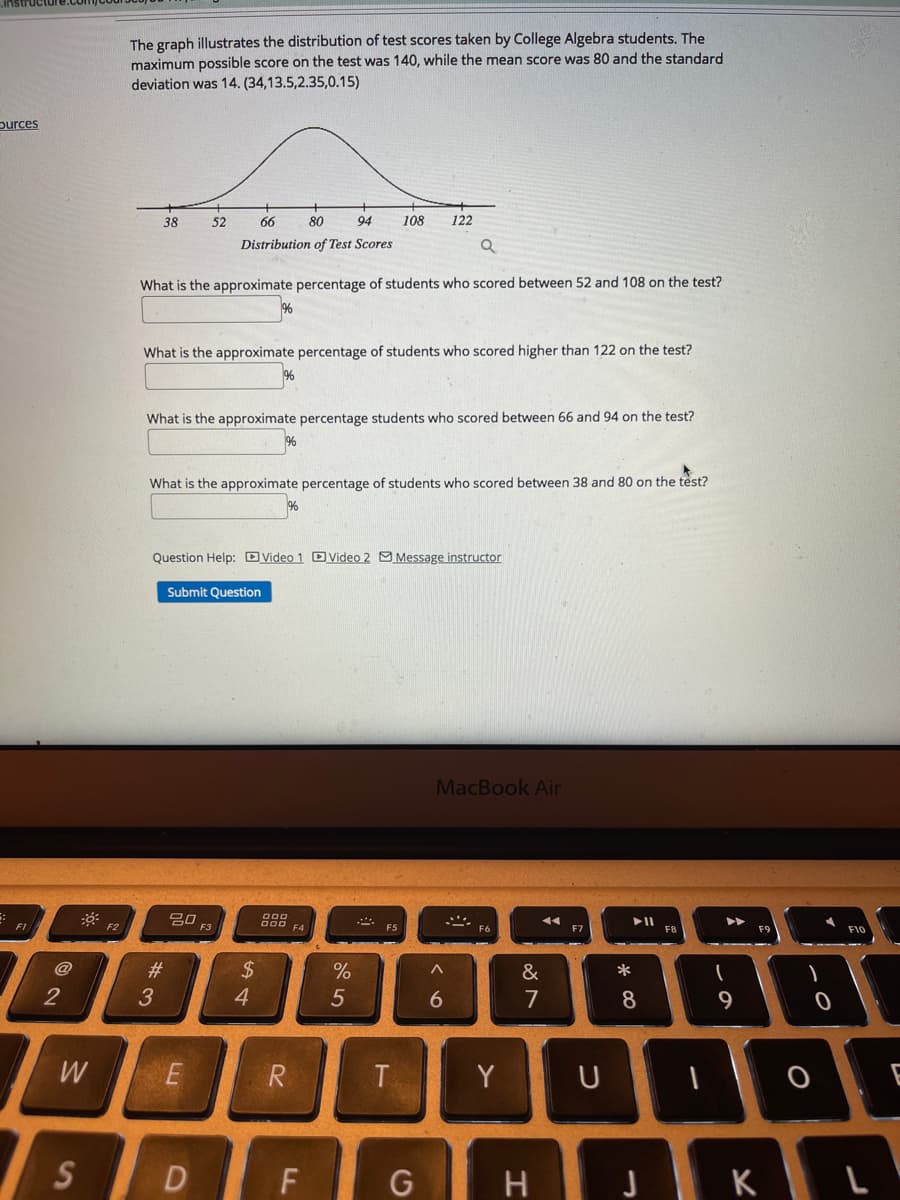
The graph illustrates the distribution of test scores taken by College Algebra students. The maximum possible score on the test was 140, while the mean score was 80 and the standard deviation was 14. (34,13.5,2.35,0.15) purces 38 52 66 80 94 108 122 Distribution of Test Scores What is the approximate percentage of students who scored between 52 and 108 on the test? What is the approximate percentage of students who scored higher than 122 on the test? What is the approximate percentage students who scored between 66 and 94 on the test? What is the approximate percentage of students who scored between 38 and 80 on the test?


Inverse Normal Distribution
The method used for finding the corresponding z-critical value in a normal distribution using the known probability is said to be an inverse normal distribution. The inverse normal distribution is a continuous probability distribution with a family of two parameters.
Mean, Median, Mode
It is a descriptive summary of a data set. It can be defined by using some of the measures. The central tendencies do not provide information regarding individual data from the dataset. However, they give a summary of the data set. The central tendency or measure of central tendency is a central or typical value for a probability distribution.
Z-Scores
A z-score is a unit of measurement used in statistics to describe the position of a raw score in terms of its distance from the mean, measured with reference to standard deviation from the mean. Z-scores are useful in statistics because they allow comparison between two scores that belong to different normal distributions.


Trending now
This is a popular solution!

Step by step
Solved in 2 steps with 2 images


