The graph illustrates the distribution of test scores taken by College Algebra students. The maximum possible score on the test was 130, while the mean score was 77 and the standard deviation was 11. Use the empirical rule to answer the following questions. 44 55 66 77 88 99 110 Distribution of Test Scores What is the approximate percentage of students who scored lower than 44 on the test? What is the approximate percentage of students who scored between 66 and 77? What is the approximate percentage of students who scored between 44 and 77 on the test? What is the approximate percentage of students who scored between 55 and 99 on the test?
The graph illustrates the distribution of test scores taken by College Algebra students. The maximum possible score on the test was 130, while the mean score was 77 and the standard deviation was 11. Use the empirical rule to answer the following questions. 44 55 66 77 88 99 110 Distribution of Test Scores What is the approximate percentage of students who scored lower than 44 on the test? What is the approximate percentage of students who scored between 66 and 77? What is the approximate percentage of students who scored between 44 and 77 on the test? What is the approximate percentage of students who scored between 55 and 99 on the test?

Glencoe Algebra 1, Student Edition, 9780079039897, 0079039898, 2018
18th Edition
ISBN:9780079039897
Author:Carter
Publisher:Carter
Chapter10: Statistics
Section10.3: Measures Of Spread
Problem 26PFA

Related questions
Question
Transcribed Image Text:Use the Empirical Rule to Answer Questions 1-4
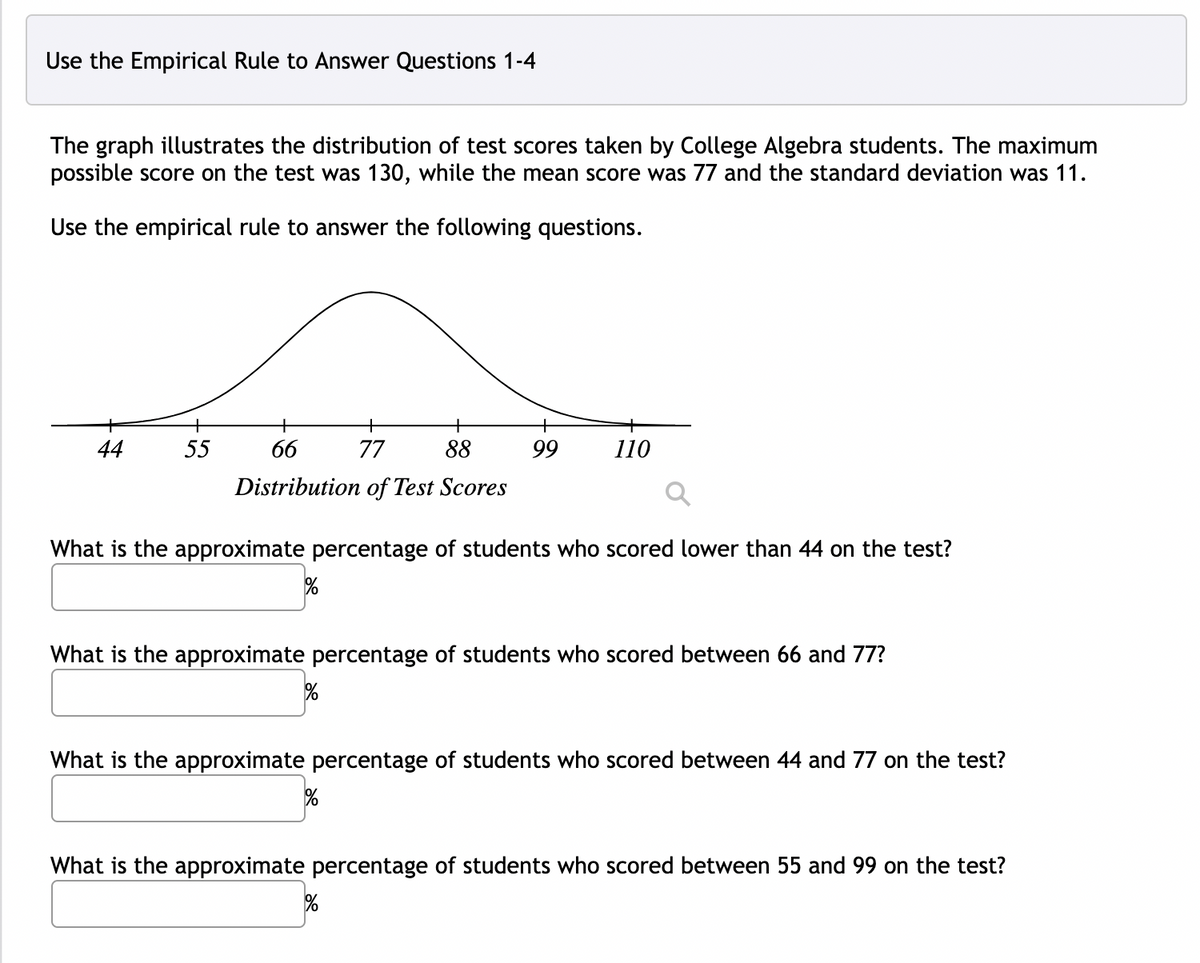
The graph illustrates the distribution of test scores taken by College Algebra students. The maximum
possible score on the test was 130, while the mean score was 77 and the standard deviation was 11.
Use the empirical rule to answer the following questions.
+
+
+
44
55
66
77
88
99
110
Distribution of Test Scores
What is the approximate percentage of students who scored lower than 44 on the test?
What is the approximate percentage of students who scored between 66 and 77?
What is the approximate percentage of students who scored between 44 and 77 on the test?
What is the approximate percentage of students who scored between 55 and 99 on the test?
it
Expert Solution
This question has been solved!
Explore an expertly crafted, step-by-step solution for a thorough understanding of key concepts.

This is a popular solution!

Trending now
This is a popular solution!

Step by step
Solved in 2 steps with 1 images

Recommended textbooks for you
Glencoe Algebra 1, Student Edition, 9780079039897…
Algebra
ISBN:
9780079039897
Author:
Carter
Publisher:
McGraw Hill
Glencoe Algebra 1, Student Edition, 9780079039897…
Algebra
ISBN:
9780079039897
Author:
Carter
Publisher:
McGraw Hill