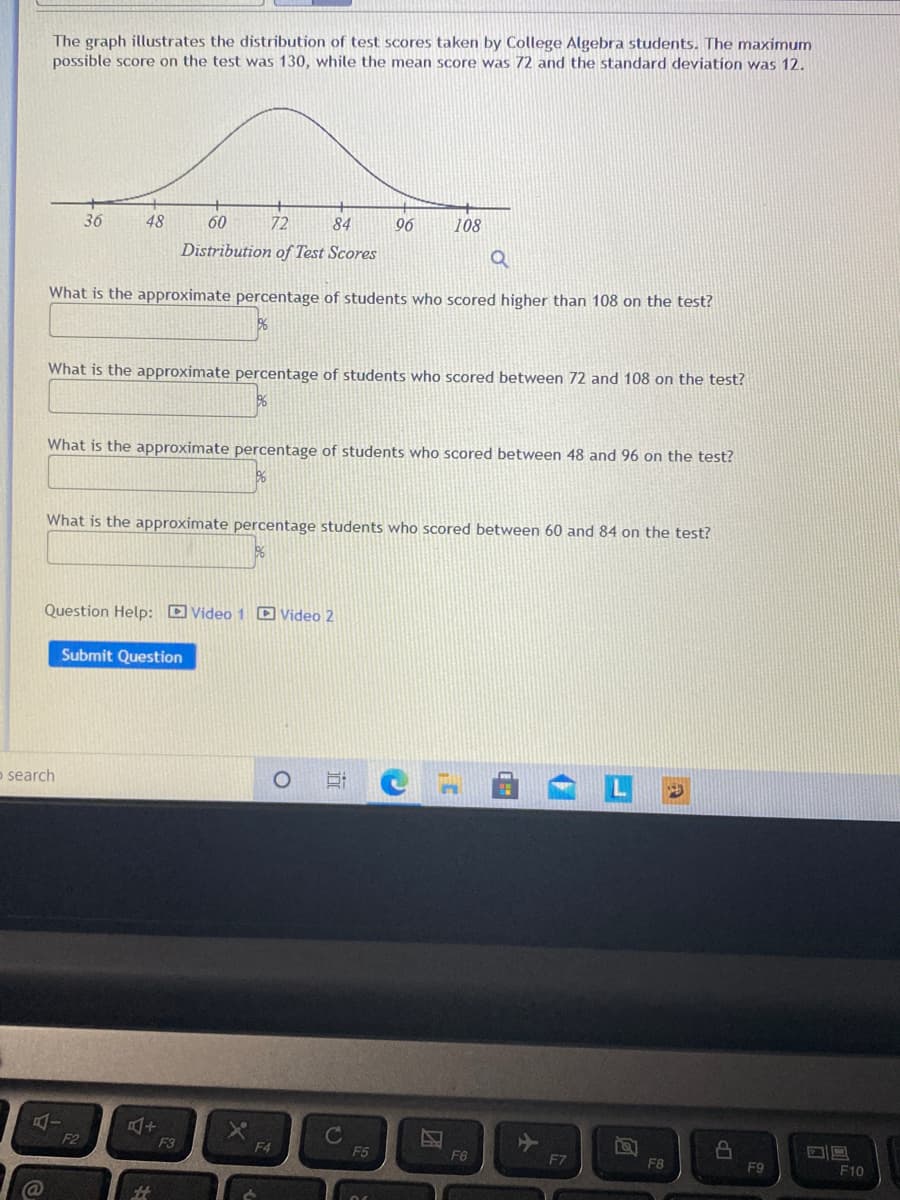
The graph illustrates the distribution of test scores taken by College Algebra students. The maximum possible score on the test was 130, while the mean score was 72 and the standard deviation was 12. 36 48 60 72 84 96 108 Distribution of Test Scores What is the approximate percentage of students who scored higher than 108 on the test? What is the approximate percentage of students who scored between 72 and 108 on the test? What is the approximate percentage of students who scored between 48 and 96 on the test?
The graph illustrates the distribution of test scores taken by College Algebra students. The maximum possible score on the test was 130, while the mean score was 72 and the standard deviation was 12. 36 48 60 72 84 96 108 Distribution of Test Scores What is the approximate percentage of students who scored higher than 108 on the test? What is the approximate percentage of students who scored between 72 and 108 on the test? What is the approximate percentage of students who scored between 48 and 96 on the test?

A First Course in Probability (10th Edition)
10th Edition
ISBN:9780134753119
Author:Sheldon Ross
Publisher:Sheldon Ross
Chapter1: Combinatorial Analysis
Section: Chapter Questions
Problem 1.1P: a. How many different 7-place license plates are possible if the first 2 places are for letters and...

Related questions
Topic Video
Question
Transcribed Image Text:The graph illustrates the distribution of test scores taken by College Algebra students. The maximum
possible score on the test was 130, while the mean score was 72 and the standard deviation was 12.
36
48
60
72
84
96
108
Distribution of Test Scores
What is the approximate percentage of students who scored higher than 108 on the test?
What is the approximate percentage of students who scored between 72 and 108 on the test?
What is the approximate percentage of students who scored between 48 and 96 on the test?
What is the approximate percentage students who scored between 60 and 84 on the test?
Question Help: D Video 1 D Video 2
Submit Question
o search
F2
F3
F4
F5
F6
F7
F8
F9
F10
团
Transcribed Image Text:What is the approximate percentage students who scored between 60 and 84 on the test?
Question Help: DVideo 1 D Video 2
Submit Question
Type here to search
C
F2
F3
F4
F5
F6
F7
F8
23
24
&
3
4.
8
W
R
T
Y
SD
F
J
C
VB
M
( CO
Expert Solution
This question has been solved!
Explore an expertly crafted, step-by-step solution for a thorough understanding of key concepts.

This is a popular solution!

Trending now
This is a popular solution!

Step by step
Solved in 3 steps with 2 images

Knowledge Booster


Learn more about
Need a deep-dive on the concept behind this application? Look no further. Learn more about this topic, probability and related others by exploring similar questions and additional content below.Recommended textbooks for you
A First Course in Probability (10th Edition)
Probability
ISBN:
9780134753119
Author:
Sheldon Ross
Publisher:
PEARSON

A First Course in Probability (10th Edition)
Probability
ISBN:
9780134753119
Author:
Sheldon Ross
Publisher:
PEARSON