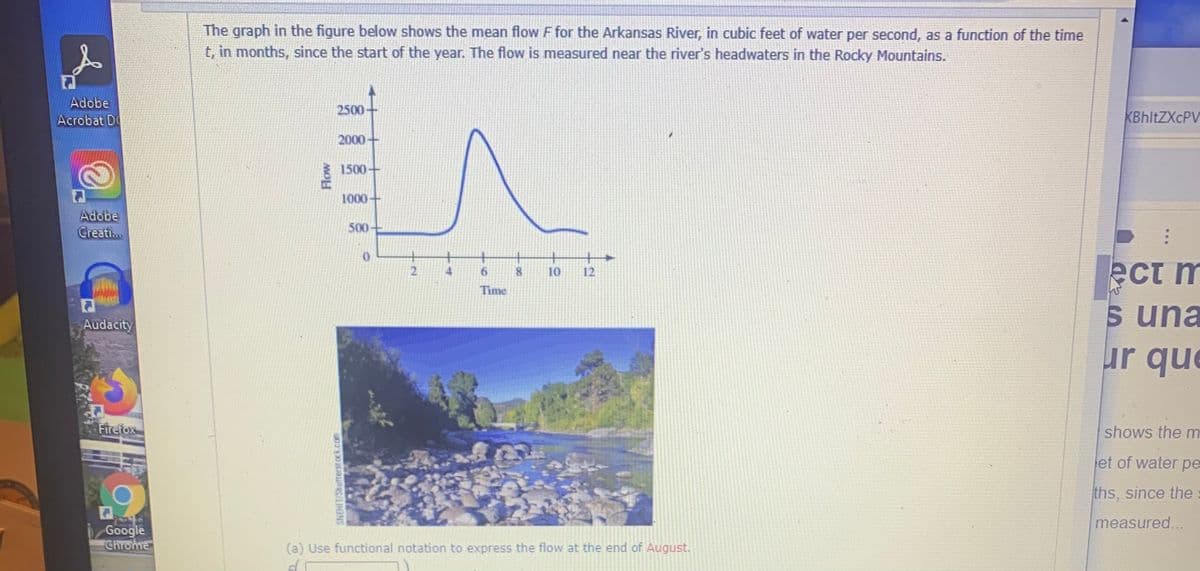
The graph in the figure below shows the mean flow F for the Arkansas River, in cubic feet of water per second, as a function of the time t, in months, since the start of the year. The flow is measured near the river's headwaters in the Rocky Mountains. (a) Use functional notation to express the flow at the end of August. F() Estimate the value of the above term. ft3 sec (b) When is the flow at its greatest? April,May, June, July, August, or October (c) At what time is the flow increasing fastest? April,May, June, July, August, or October (d) Estimate the average rate of change per month in the flow during the first 2 months of the year. ft3/sec per month (e) In light of the source of the Arkansas River, interpret your answers to parts (b), (c), and (d). Because the flow is measured near the river's headwaters in the Rocky Mountains, we expect any change in flow to come from melting snow primarily. This is consistent with the change in flow during the first two months of the year (as seen in part (d)), a ---Select--- maximum increase maximum decrease minimum increase minimum decrease in flow near the end of May (as seen in part (c)), and a ---Select--- peak flow base flow one month later (as seen in part (b).


Minimization
In mathematics, traditional optimization problems are typically expressed in terms of minimization. When we talk about minimizing or maximizing a function, we refer to the maximum and minimum possible values of that function. This can be expressed in terms of global or local range. The definition of minimization in the thesaurus is the process of reducing something to a small amount, value, or position. Minimization (noun) is an instance of belittling or disparagement.
Maxima and Minima
The extreme points of a function are the maximum and the minimum points of the function. A maximum is attained when the function takes the maximum value and a minimum is attained when the function takes the minimum value.
Derivatives
A derivative means a change. Geometrically it can be represented as a line with some steepness. Imagine climbing a mountain which is very steep and 500 meters high. Is it easier to climb? Definitely not! Suppose walking on the road for 500 meters. Which one would be easier? Walking on the road would be much easier than climbing a mountain.
Concavity
In calculus, concavity is a descriptor of mathematics that tells about the shape of the graph. It is the parameter that helps to estimate the maximum and minimum value of any of the functions and the concave nature using the graphical method. We use the first derivative test and second derivative test to understand the concave behavior of the function.
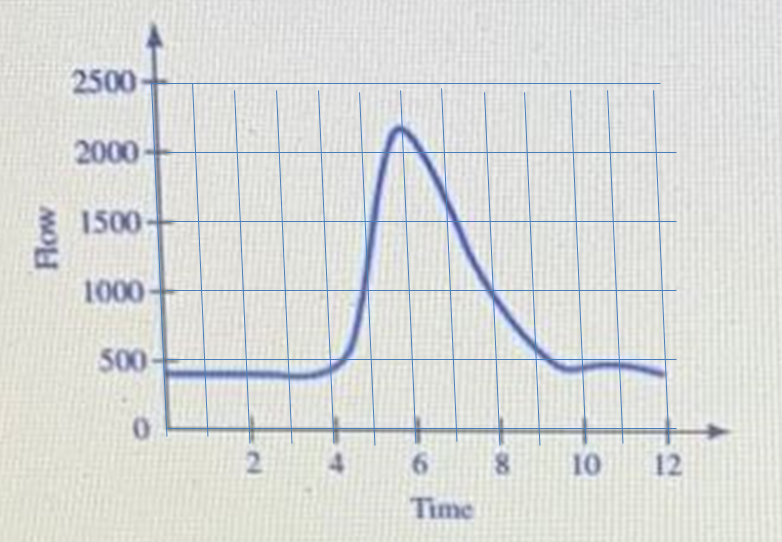
The graph in the figure below shows the mean flow F for the Arkansas River, in cubic feet of water per second, as a function of the time t, in months, since the start of the year. The flow is measured near the river's headwaters in the Rocky Mountains.
Estimate the value of the above term.
| ft3 |
| sec |
(b) When is the flow at its greatest?
ft3/sec per month
(e) In light of the source of the Arkansas River, interpret your answers to parts (b), (c), and (d).

Trending now
This is a popular solution!

Step by step
Solved in 6 steps with 1 images


