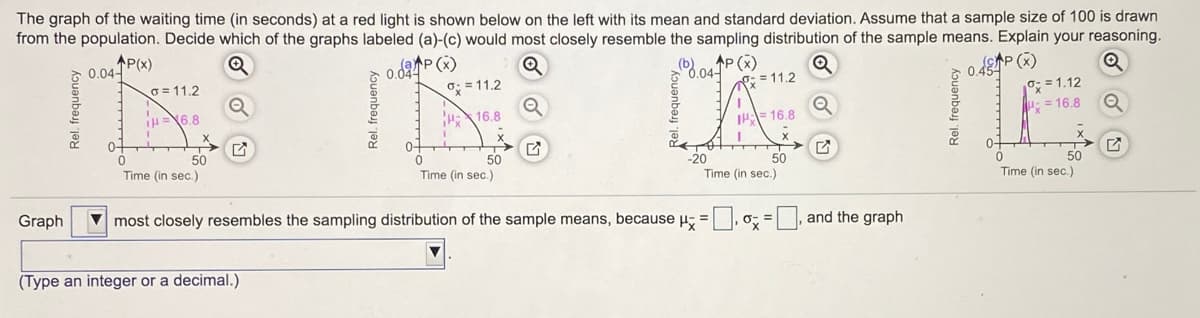
The graph of the waiting time (in seconds) at a red light is shown below on the left with its mean and standard deviation. Assume that a sample size of 100 is drawn from the population. Decide which of the graphs labeled (a)-(c) would most closely resemble the sampling distribution of the sample means. Explain your reasoning. P(x) 0.04- 0.024P (x) o: =11.2 P(x) = 11.2 AP (x) 0.454 o = 1.12 = 16.8 O = 11.2 iH=6.8 H16.8 IH= 16.8 0- 0- -20 50 Time (in sec.) 50 50 Time (in sec.) 50 Time (in sec.) Time (in sec.) Graph V most closely resembles the sampling distribution of the sample means, because u- = |,0; =, and the graph (Type an integer or a decimal.)


Inverse Normal Distribution
The method used for finding the corresponding z-critical value in a normal distribution using the known probability is said to be an inverse normal distribution. The inverse normal distribution is a continuous probability distribution with a family of two parameters.
Mean, Median, Mode
It is a descriptive summary of a data set. It can be defined by using some of the measures. The central tendencies do not provide information regarding individual data from the dataset. However, they give a summary of the data set. The central tendency or measure of central tendency is a central or typical value for a probability distribution.
Z-Scores
A z-score is a unit of measurement used in statistics to describe the position of a raw score in terms of its distance from the mean, measured with reference to standard deviation from the mean. Z-scores are useful in statistics because they allow comparison between two scores that belong to different normal distributions.


Trending now
This is a popular solution!

Step by step
Solved in 2 steps with 1 images


