The graph of voltage (independent variable) vs current (dependent variable) should have voltage on the x-axis and current on the y-axis. The experimenter controls voltage and then measures current. You should use the best fit linear regression to find the best straight line fit for your data points. The slope will be delta amps/delta volts. If you rearrange Ohm's Law you will discover this slope is equal to 1/R. The independent direct measurement of the value of the resistor used will allow you to calculate a % error, which is a comparison of the value for R determined by the slope of your graph vs the direct measurement of resistance. % error = (direct measurement of R - slope R/ direct measurement of R) x 100 The video does not include the direct measurement of resistance, so use the value of 10.0 ohms as the direct measurement value (or accepted value).
The graph of voltage (independent variable) vs current (dependent variable) should have voltage on the x-axis and current on the y-axis. The experimenter controls voltage and then measures current. You should use the best fit linear regression to find the best straight line fit for your data points. The slope will be delta amps/delta volts. If you rearrange Ohm's Law you will discover this slope is equal to 1/R. The independent direct measurement of the value of the resistor used will allow you to calculate a % error, which is a comparison of the value for R determined by the slope of your graph vs the direct measurement of resistance. % error = (direct measurement of R - slope R/ direct measurement of R) x 100 The video does not include the direct measurement of resistance, so use the value of 10.0 ohms as the direct measurement value (or accepted value).

College Physics
1st Edition
ISBN:9781938168000
Author:Paul Peter Urone, Roger Hinrichs
Publisher:Paul Peter Urone, Roger Hinrichs
Chapter20: Electric Current, Resistance, And Ohm's Law
Section: Chapter Questions
Problem 45PE: Verify that the units of a volt-ampere are watts, as implied by the equation P =IV.

Related questions
Question
100%
The first image is the data that I collected and the second image is what I need help with doing
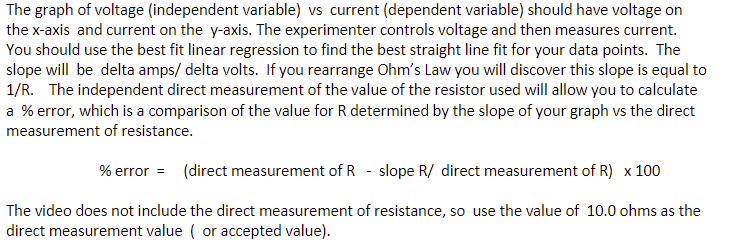
Transcribed Image Text:The graph of voltage (independent variable) vs current (dependent variable) should have voltage on
the x-axis and current on the y-axis. The experimenter controls voltage and then measures current.
You should use the best fit linear regression to find the best straight line fit for your data points. The
slope will be delta amps/delta volts. If you rearrange Ohm's Law you will discover this slope is equal to
1/R. The independent direct measurement of the value of the resistor used will allow you to calculate
a % error, which is a comparison of the value for R determined by the slope of your graph vs the direct
measurement of resistance.
% error = (direct measurement of R - slope R/ direct measurement of R) x 100
The video does not include the direct measurement of resistance, so use the value of 10.0 ohms as the
direct measurement value (or accepted value).
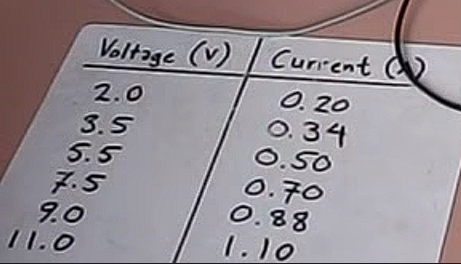
Transcribed Image Text:Voltage (V) Current
0.20
0.34
2.0
11.0
3.5
5.5
7.5
9.0
0.50
0.70
0.88
1.10
Expert Solution
This question has been solved!
Explore an expertly crafted, step-by-step solution for a thorough understanding of key concepts.

This is a popular solution!

Trending now
This is a popular solution!

Step by step
Solved in 3 steps with 3 images

Knowledge Booster


Learn more about
Need a deep-dive on the concept behind this application? Look no further. Learn more about this topic, physics and related others by exploring similar questions and additional content below.Recommended textbooks for you
College Physics
Physics
ISBN:
9781938168000
Author:
Paul Peter Urone, Roger Hinrichs
Publisher:
OpenStax College

Physics for Scientists and Engineers, Technology …
Physics
ISBN:
9781305116399
Author:
Raymond A. Serway, John W. Jewett
Publisher:
Cengage Learning

An Introduction to Physical Science
Physics
ISBN:
9781305079137
Author:
James Shipman, Jerry D. Wilson, Charles A. Higgins, Omar Torres
Publisher:
Cengage Learning
College Physics
Physics
ISBN:
9781938168000
Author:
Paul Peter Urone, Roger Hinrichs
Publisher:
OpenStax College
Physics for Scientists and Engineers, Technology …
Physics
ISBN:
9781305116399
Author:
Raymond A. Serway, John W. Jewett
Publisher:
Cengage Learning
An Introduction to Physical Science
Physics
ISBN:
9781305079137
Author:
James Shipman, Jerry D. Wilson, Charles A. Higgins, Omar Torres
Publisher:
Cengage Learning


Glencoe Physics: Principles and Problems, Student…
Physics
ISBN:
9780078807213
Author:
Paul W. Zitzewitz
Publisher:
Glencoe/McGraw-Hill

Principles of Physics: A Calculus-Based Text
Physics
ISBN:
9781133104261
Author:
Raymond A. Serway, John W. Jewett
Publisher:
Cengage Learning