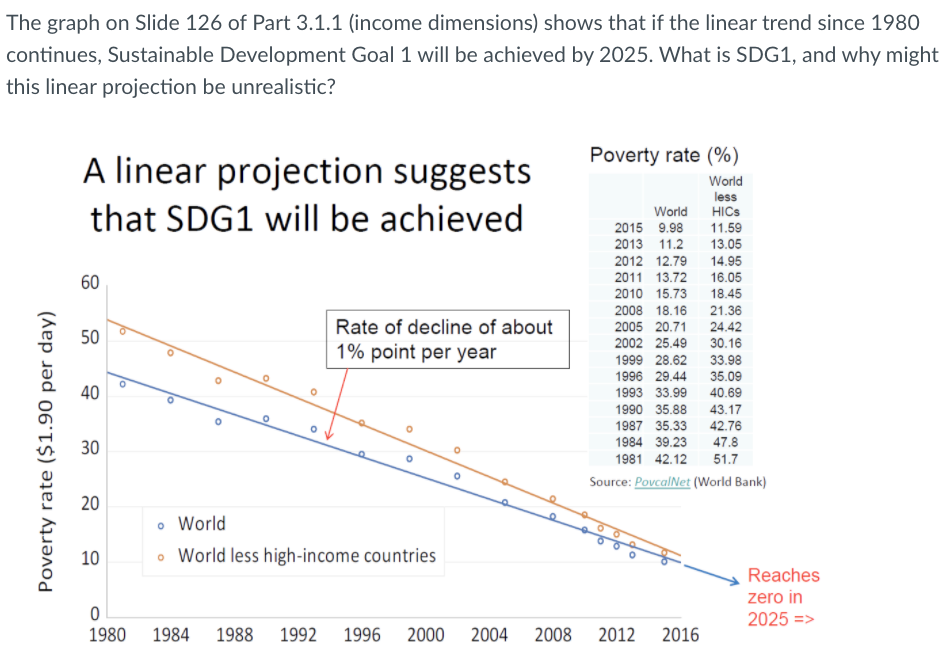
The graph on Slide 126 of Part 3.1.1 (income dimensions) shows that if the linear trend since 1980 continues, Sustainable Development Goal 1 will be achieved by 2025. What is SDG1, and why might this linear projection be unrealistic?
The graph on Slide 126 of Part 3.1.1 (income dimensions) shows that if the linear trend since 1980 continues, Sustainable Development Goal 1 will be achieved by 2025. What is SDG1, and why might this linear projection be unrealistic?

Microeconomics: Principles & Policy
14th Edition
ISBN:9781337794992
Author:William J. Baumol, Alan S. Blinder, John L. Solow
Publisher:William J. Baumol, Alan S. Blinder, John L. Solow
Chapter20: Poverty, Inequality, And Discrimination
Section: Chapter Questions
Problem 3DQ

Related questions
Question
Transcribed Image Text:The graph on Slide 126 of Part 3.1.1 (income dimensions) shows that if the linear trend since 1980
continues, Sustainable Development Goal 1 will be achieved by 2025. What is SDG1, and why might
this linear projection be unrealistic?
Poverty rate (%)
A linear projection suggests
World
less
HICS
that SDG1 will be achieved
World
2015 9.98
11.59
2013 11.2
13.05
2012 12.79
14.95
2011 13.72
2010 15.73
60
16.05
18.45
2008 18.16
21.36
Rate of decline of about
2005 20.71
24.42
50
2002 25.49
30.16
1% point per year
1999 28.62
33.98
1996 29.44
35.09
40
1993 33.99
40.69
43.17
42.76
1990 35.88
1987 35.33
30
1984 39.23
47.8
1981 42.12
51.7
Source: PovcalNet (World Bank)
• World
10
• World less high-income countries
Reaches
zero in
2025 =>
1980
1984
1988
1992
1996 2000
2004
2008
2012
2016
Poverty rate ($1.90 per day)
20
Expert Solution
This question has been solved!
Explore an expertly crafted, step-by-step solution for a thorough understanding of key concepts.

Step by step
Solved in 3 steps

Knowledge Booster


Learn more about
Need a deep-dive on the concept behind this application? Look no further. Learn more about this topic, economics and related others by exploring similar questions and additional content below.Recommended textbooks for you
Microeconomics: Principles & Policy
Economics
ISBN:
9781337794992
Author:
William J. Baumol, Alan S. Blinder, John L. Solow
Publisher:
Cengage Learning


Microeconomics: Principles & Policy
Economics
ISBN:
9781337794992
Author:
William J. Baumol, Alan S. Blinder, John L. Solow
Publisher:
Cengage Learning

Exploring Economics
Economics
ISBN:
9781544336329
Author:
Robert L. Sexton
Publisher:
SAGE Publications, Inc

Principles of Economics 2e
Economics
ISBN:
9781947172364
Author:
Steven A. Greenlaw; David Shapiro
Publisher:
OpenStax
