The graph on the right shows the marginal revenue, marginal cost, and average total cost curves for a firm in a perfectly competitive market. If this firm produced at the profit-maximizing output level, what would be the size of this firm's profits or losses? 1.) Using the rectangle drawing tool, illustrate the size of this firm's profits or losses if it produces at the profit-maximizing output level. Label the area appropriately. Carefully follow the instructions above and only draw the required object. Quantity Marginal Cost Average Total Cost MR
The graph on the right shows the marginal revenue, marginal cost, and average total cost curves for a firm in a perfectly competitive market. If this firm produced at the profit-maximizing output level, what would be the size of this firm's profits or losses? 1.) Using the rectangle drawing tool, illustrate the size of this firm's profits or losses if it produces at the profit-maximizing output level. Label the area appropriately. Carefully follow the instructions above and only draw the required object. Quantity Marginal Cost Average Total Cost MR

Microeconomics: Private and Public Choice (MindTap Course List)
16th Edition
ISBN:9781305506893
Author:James D. Gwartney, Richard L. Stroup, Russell S. Sobel, David A. Macpherson
Publisher:James D. Gwartney, Richard L. Stroup, Russell S. Sobel, David A. Macpherson
Chapter10: Price-searcher Markets With Low Entry Barriers
Section: Chapter Questions
Problem 15CQ

Related questions
Question
Transcribed Image Text:<
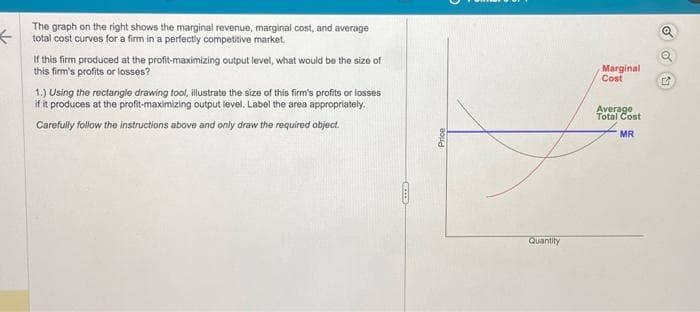
The graph on the right shows the marginal revenue, marginal cost, and average
total cost curves for a firm in a perfectly competitive market.
If this firm produced at the profit-maximizing output level, what would be the size of
this firm's profits or losses?
1.) Using the rectangle drawing tool, illustrate the size of this firm's profits or losses
if it produces at the profit-maximizing output level. Label the area appropriately.
Carefully follow the instructions above and only draw the required object.
CETTE
Price
Quantity
Marginal
Cost
Average
Total Cost
MR
Q
Transcribed Image Text:←
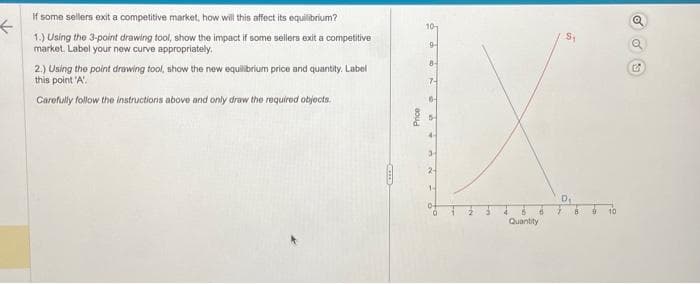
If some sellers exit a competitive market, how will this affect its equilibrium?
1.) Using the 3-point drawing tool, show the impact if some sellers exit a competitive
market. Label your new curve appropriately.
2.) Using the point drawing tool, show the new equilibrium price and quantity. Label
this point 'A'.
Carefully follow the instructions above and only draw the required objects.
SCIEE
Price
10
9
8-
7-
6-
2
66
Quantity
S₁
C
Expert Solution
This question has been solved!
Explore an expertly crafted, step-by-step solution for a thorough understanding of key concepts.

This is a popular solution!

Trending now
This is a popular solution!

Step by step
Solved in 3 steps with 2 images

Knowledge Booster


Learn more about
Need a deep-dive on the concept behind this application? Look no further. Learn more about this topic, economics and related others by exploring similar questions and additional content below.Recommended textbooks for you
Microeconomics: Private and Public Choice (MindTa…
Economics
ISBN:
9781305506893
Author:
James D. Gwartney, Richard L. Stroup, Russell S. Sobel, David A. Macpherson
Publisher:
Cengage Learning

Economics: Private and Public Choice (MindTap Cou…
Economics
ISBN:
9781305506725
Author:
James D. Gwartney, Richard L. Stroup, Russell S. Sobel, David A. Macpherson
Publisher:
Cengage Learning
Microeconomics: Private and Public Choice (MindTa…
Economics
ISBN:
9781305506893
Author:
James D. Gwartney, Richard L. Stroup, Russell S. Sobel, David A. Macpherson
Publisher:
Cengage Learning
Economics: Private and Public Choice (MindTap Cou…
Economics
ISBN:
9781305506725
Author:
James D. Gwartney, Richard L. Stroup, Russell S. Sobel, David A. Macpherson
Publisher:
Cengage Learning