The graph portrays the decision criterion for a hypothesis test for a population mean. The null hypothesis is H,: u = µg. The curve is the normal curve for the test statistic under the assumption that the null hypothesis is true. Use the graph to solve the problem. A graphical display of the decision criterion follows. Do not reject H Reject H, 0.24 !o 014 A3- AM 2197 Determine the rejection region. O0.014 02197 O All z-scores that lie to the right of 2.197 O All 2-scores that lie to the left of 2.197
The graph portrays the decision criterion for a hypothesis test for a population mean. The null hypothesis is H,: u = µg. The curve is the normal curve for the test statistic under the assumption that the null hypothesis is true. Use the graph to solve the problem. A graphical display of the decision criterion follows. Do not reject H Reject H, 0.24 !o 014 A3- AM 2197 Determine the rejection region. O0.014 02197 O All z-scores that lie to the right of 2.197 O All 2-scores that lie to the left of 2.197

Glencoe Algebra 1, Student Edition, 9780079039897, 0079039898, 2018
18th Edition
ISBN:9780079039897
Author:Carter
Publisher:Carter
Chapter10: Statistics
Section10.4: Distributions Of Data
Problem 19PFA

Related questions
Question
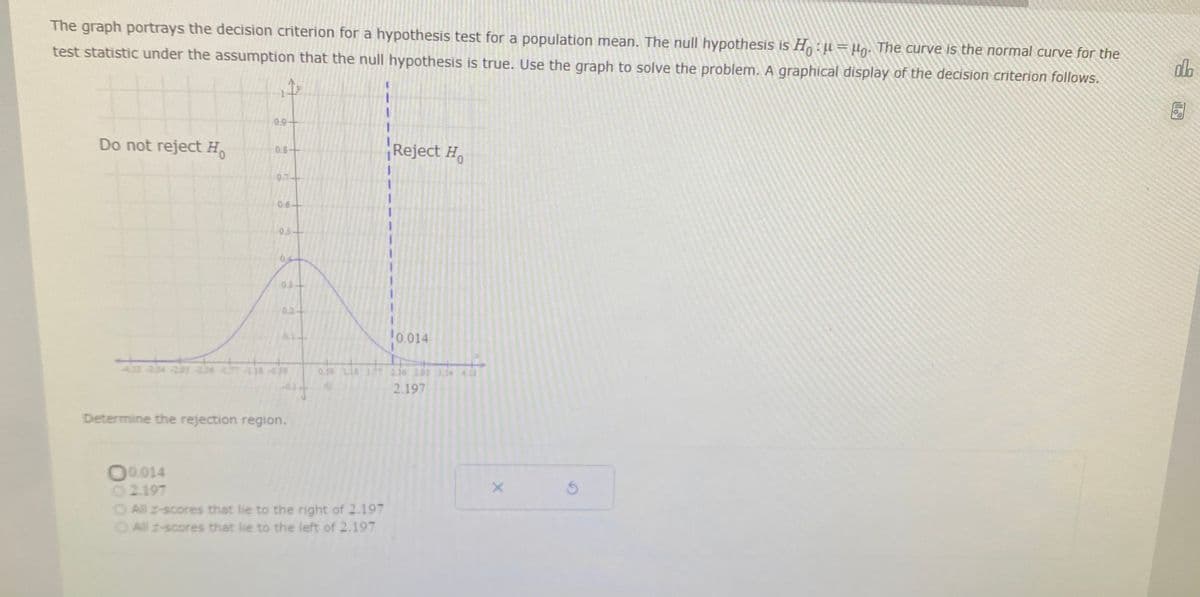
Transcribed Image Text:The graph portrays the decision criterion for a hypothesis test for a population mean. The null hypothesis is H:u=µ. The curve is the normal curve for the
test statistic under the assumption that the null hypothesis is true. Use the graph to solve the problem. A graphical display of the decision criterion follows.
do
0.9
Do not reject H
Reject H,
0.8-
0.7-
0.6-
05-
04
0.3-
0.2-
0.1-
!0.014
-059
0.59 L18 137 236 295 3.54
2.197
Determine the rejection region.
O0.014
02.197
O All z-scores that lie to the right of 2.197
OAll 2-scores that lie to the left of 2.197
Expert Solution
This question has been solved!
Explore an expertly crafted, step-by-step solution for a thorough understanding of key concepts.

This is a popular solution!

Trending now
This is a popular solution!

Step by step
Solved in 2 steps

Recommended textbooks for you
Glencoe Algebra 1, Student Edition, 9780079039897…
Algebra
ISBN:
9780079039897
Author:
Carter
Publisher:
McGraw Hill
Glencoe Algebra 1, Student Edition, 9780079039897…
Algebra
ISBN:
9780079039897
Author:
Carter
Publisher:
McGraw Hill