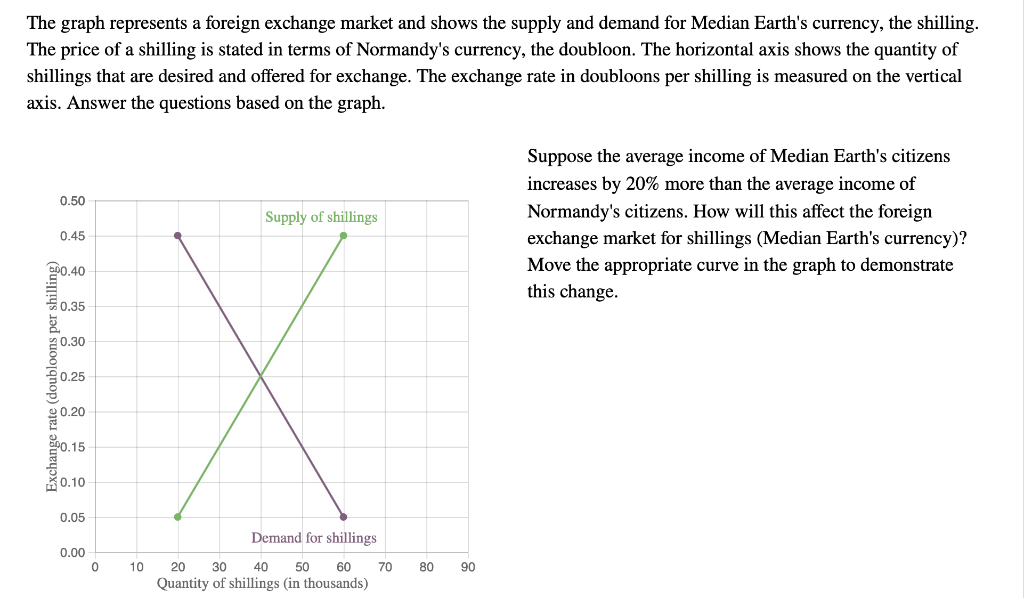
The graph represents a foreign exchange market and shows the supply and demand for Median Earth's currency, the shilling. The price of a shilling is stated in terms of Normandy's currency, the doubloon. The horizontal axis shows the quantity of shillings that are desired and offered for exchange. The exchange rate in doubloons per shilling is measured on the vertical axis. Answer the questions based on the graph.
The graph represents a foreign exchange market and shows the supply and demand for Median Earth's currency, the shilling. The price of a shilling is stated in terms of Normandy's currency, the doubloon. The horizontal axis shows the quantity of shillings that are desired and offered for exchange. The exchange rate in doubloons per shilling is measured on the vertical axis. Answer the questions based on the graph.

Microeconomics A Contemporary Intro
10th Edition
ISBN:9781285635101
Author:MCEACHERN
Publisher:MCEACHERN
Chapter20: International Finance
Section: Chapter Questions
Problem 10PAE

Related questions
Question
The graph represents a foreign exchange market and shows the
Transcribed Image Text:The graph represents a foreign exchange market and shows the supply and demand for Median Earth's currency, the shilling.
The price of a shilling is stated in terms of Normandy's currency, the doubloon. The horizontal axis shows the quantity of
shillings that are desired and offered for exchange. The exchange rate in doubloons per shilling is measured on the vertical
axis. Answer the questions based on the graph.
0.50
0.45
00.40
0.35
gd
0.30
0.25
€0.20
00.15
0.10
0.05
0.00
0
10
Supply of shillings
Demand for shillings
20 30 40 50 60
Quantity of shillings (in thousands)
70 80 90
Suppose the average income of Median Earth's citizens
increases by 20% more than the average income of
Normandy's citizens. How will this affect the foreign
exchange market for shillings (Median Earth's currency)?
Move the appropriate curve in the graph to demonstrate
this change.
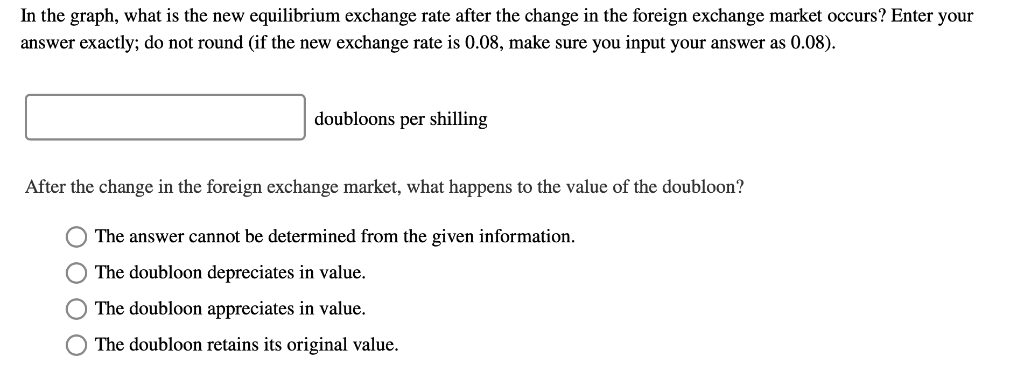
Transcribed Image Text:In the graph, what is the new equilibrium exchange rate after the change in the foreign exchange market occurs? Enter your
answer exactly; do not round (if the new exchange rate is 0.08, make sure you input your answer as 0.08).
doubloons per shilling
After the change in the foreign exchange market, what happens to the value of the doubloon?
O The answer cannot be determined from the given information.
O The doubloon depreciates in value.
O The doubloon appreciates in value.
O The doubloon retains its original value.
Expert Solution
This question has been solved!
Explore an expertly crafted, step-by-step solution for a thorough understanding of key concepts.

This is a popular solution!

Trending now
This is a popular solution!

Step by step
Solved in 4 steps with 3 images

Knowledge Booster


Learn more about
Need a deep-dive on the concept behind this application? Look no further. Learn more about this topic, economics and related others by exploring similar questions and additional content below.Recommended textbooks for you


Exploring Economics
Economics
ISBN:
9781544336329
Author:
Robert L. Sexton
Publisher:
SAGE Publications, Inc