The graph shows the annual income of three company in London 2000 2020. Summarize the information selecting and reporting the main features, and make comparisons where relevant. 120,000 100,000 Bernie's Buns Lovely Loaves Robbie's Bakery 80,000- 60.000- 40,000 20,000- 0- 2000 2001 2002 2003 2004 2005 2006 2007 2008 2009 2010 year yearly income (£)
The graph shows the annual income of three company in London 2000 2020. Summarize the information selecting and reporting the main features, and make comparisons where relevant. 120,000 100,000 Bernie's Buns Lovely Loaves Robbie's Bakery 80,000- 60.000- 40,000 20,000- 0- 2000 2001 2002 2003 2004 2005 2006 2007 2008 2009 2010 year yearly income (£)

Principles of Economics 2e
2nd Edition
ISBN:9781947172364
Author:Steven A. Greenlaw; David Shapiro
Publisher:Steven A. Greenlaw; David Shapiro
Chapter17: Financial Markets
Section: Chapter Questions
Problem 5SCQ: Investors sometimes fear that a high-risk investment is especially likely to have low returns. Is...

Related questions
Question
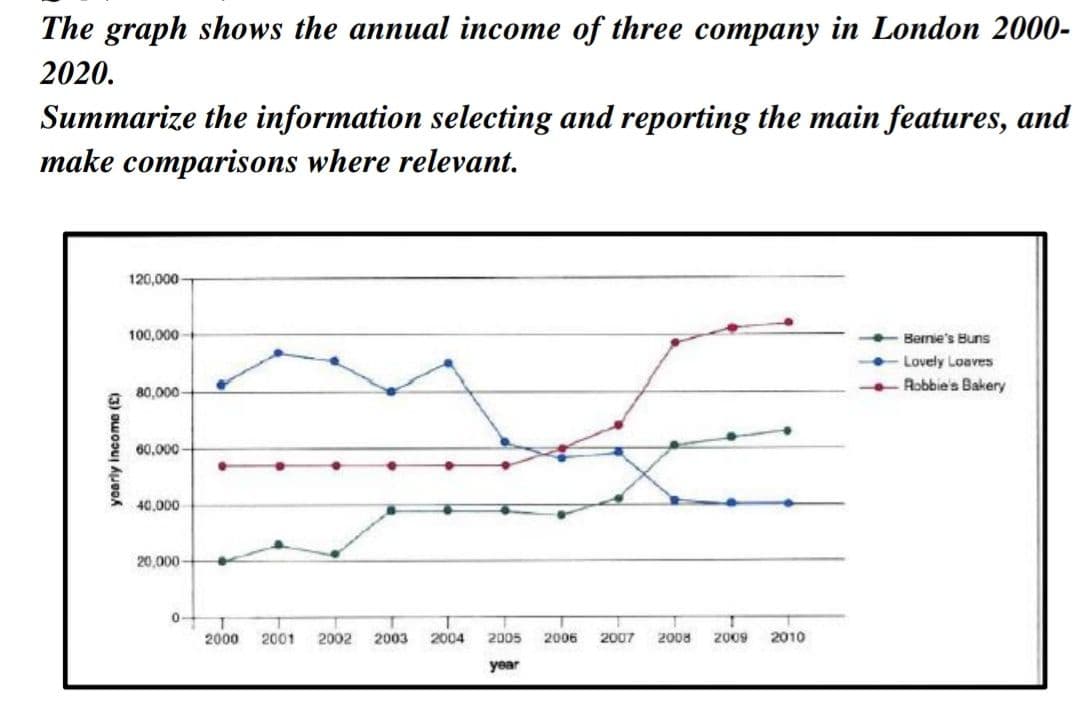
Transcribed Image Text:The graph shows the annual income of three company in London 2000-
2020.
Summarize the information selecting and reporting the main features, and
make comparisons where relevant.
120,000-
100,000
- Bernie's Buns
Lovely Loaves
Robbie's Bakery
80,000-
60.000-
40,000
20,000-
0-
2000
2001
2002
2003
2004 2005
2006
2007
2008
2009
2010
year
yearly income (£)
Expert Solution
This question has been solved!
Explore an expertly crafted, step-by-step solution for a thorough understanding of key concepts.

Step by step
Solved in 2 steps

Knowledge Booster


Learn more about
Need a deep-dive on the concept behind this application? Look no further. Learn more about this topic, economics and related others by exploring similar questions and additional content below.Recommended textbooks for you
Principles of Economics 2e
Economics
ISBN:
9781947172364
Author:
Steven A. Greenlaw; David Shapiro
Publisher:
OpenStax
Principles of Economics 2e
Economics
ISBN:
9781947172364
Author:
Steven A. Greenlaw; David Shapiro
Publisher:
OpenStax