The graph shows the demand curve, marginal revenue curve, and marginal cost curve of Big Splash, Inc., a producer of wading pools in monopolistic competition. Draw a point at the firm's profit-maximizing price and quantity. Draw a vertical arrow that shows the firm's markup. Draw a shape that shows the firm's economic profit. Big Splash's markup is $a pool. Big Splash's excess capacity is Big Splash's economic profit is $ 360 340 320- 300- 280- 260 240- 220- Price and cost (dollars per pool) 200- 180- 160- 140- 120- 100- 80 60- 40+ 0 MC ATC D MR Q 10 20 30 40 50 60 70 80 Quantity (pools per week) >>> Draw only the objects specified in the question.
The graph shows the demand curve, marginal revenue curve, and marginal cost curve of Big Splash, Inc., a producer of wading pools in monopolistic competition. Draw a point at the firm's profit-maximizing price and quantity. Draw a vertical arrow that shows the firm's markup. Draw a shape that shows the firm's economic profit. Big Splash's markup is $a pool. Big Splash's excess capacity is Big Splash's economic profit is $ 360 340 320- 300- 280- 260 240- 220- Price and cost (dollars per pool) 200- 180- 160- 140- 120- 100- 80 60- 40+ 0 MC ATC D MR Q 10 20 30 40 50 60 70 80 Quantity (pools per week) >>> Draw only the objects specified in the question.

Chapter14: Monopolistic Competition And Product Differentiation
Section: Chapter Questions
Problem 10P

Related questions
Question
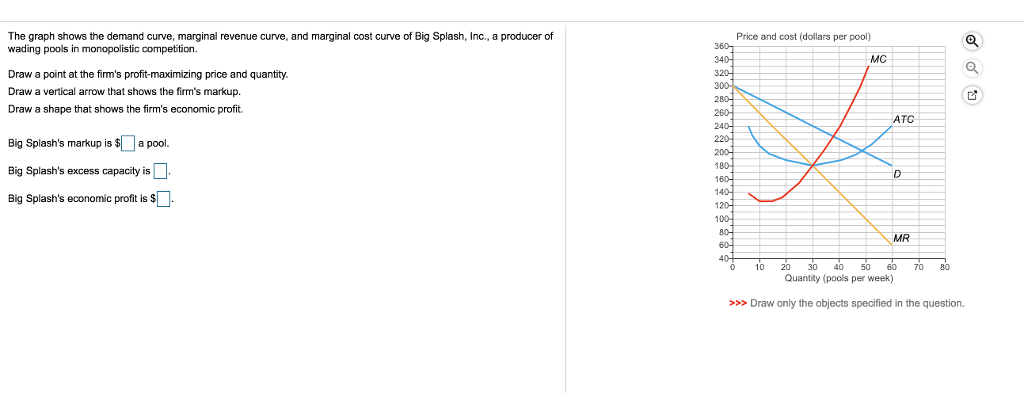
Transcribed Image Text:The graph shows the demand curve, marginal revenue curve, and marginal cost curve of Big Splash, Inc., a producer of
wading pools in monopolistic competition.
Draw a point at the firm's profit-maximizing price and quantity.
Draw a vertical arrow that shows the firm's markup.
Draw a shape that shows the firm's economic profit.
Big Splash's markup is $ a pool.
Big Splash's excess capacity is
Big Splash's economic profit is $
360
340-
320
300-
280-
260-
240-
220-
200-
180-
160-
140-
120-
100-
80-
60-
40+
Price and cost (dollars per pool)
0 10
MC
20
ATC
D
MR
30 40 50 60 70 80
Quantity (pools per week)
>>> Draw only the objects specified in the question.
Q
Q
Expert Solution
This question has been solved!
Explore an expertly crafted, step-by-step solution for a thorough understanding of key concepts.

This is a popular solution!

Trending now
This is a popular solution!

Step by step
Solved in 5 steps with 1 images

Knowledge Booster


Learn more about
Need a deep-dive on the concept behind this application? Look no further. Learn more about this topic, economics and related others by exploring similar questions and additional content below.Recommended textbooks for you
Exploring Economics
Economics
ISBN:
9781544336329
Author:
Robert L. Sexton
Publisher:
SAGE Publications, Inc


Exploring Economics
Economics
ISBN:
9781544336329
Author:
Robert L. Sexton
Publisher:
SAGE Publications, Inc

Principles of Economics 2e
Economics
ISBN:
9781947172364
Author:
Steven A. Greenlaw; David Shapiro
Publisher:
OpenStax

