The graph shows the distribution of the cost of drinks What percentage of coffee drinks cost within $1.50 of at a popular coffee shop. The distribution is approximately Normal, with a mean of $3.34 and a standard deviation of $0.75. the mean? O 34% 68% Coffee Drinks 95% 99.7% 0.34 1.09 1.84 2.59 3.34 4.09 4.84 5.59 6.34 Cost (Dollars). Mark this and return Save and Exit Next Submit
The graph shows the distribution of the cost of drinks What percentage of coffee drinks cost within $1.50 of at a popular coffee shop. The distribution is approximately Normal, with a mean of $3.34 and a standard deviation of $0.75. the mean? O 34% 68% Coffee Drinks 95% 99.7% 0.34 1.09 1.84 2.59 3.34 4.09 4.84 5.59 6.34 Cost (Dollars). Mark this and return Save and Exit Next Submit

Glencoe Algebra 1, Student Edition, 9780079039897, 0079039898, 2018
18th Edition
ISBN:9780079039897
Author:Carter
Publisher:Carter
Chapter10: Statistics
Section10.4: Distributions Of Data
Problem 19PFA

Related questions
Question
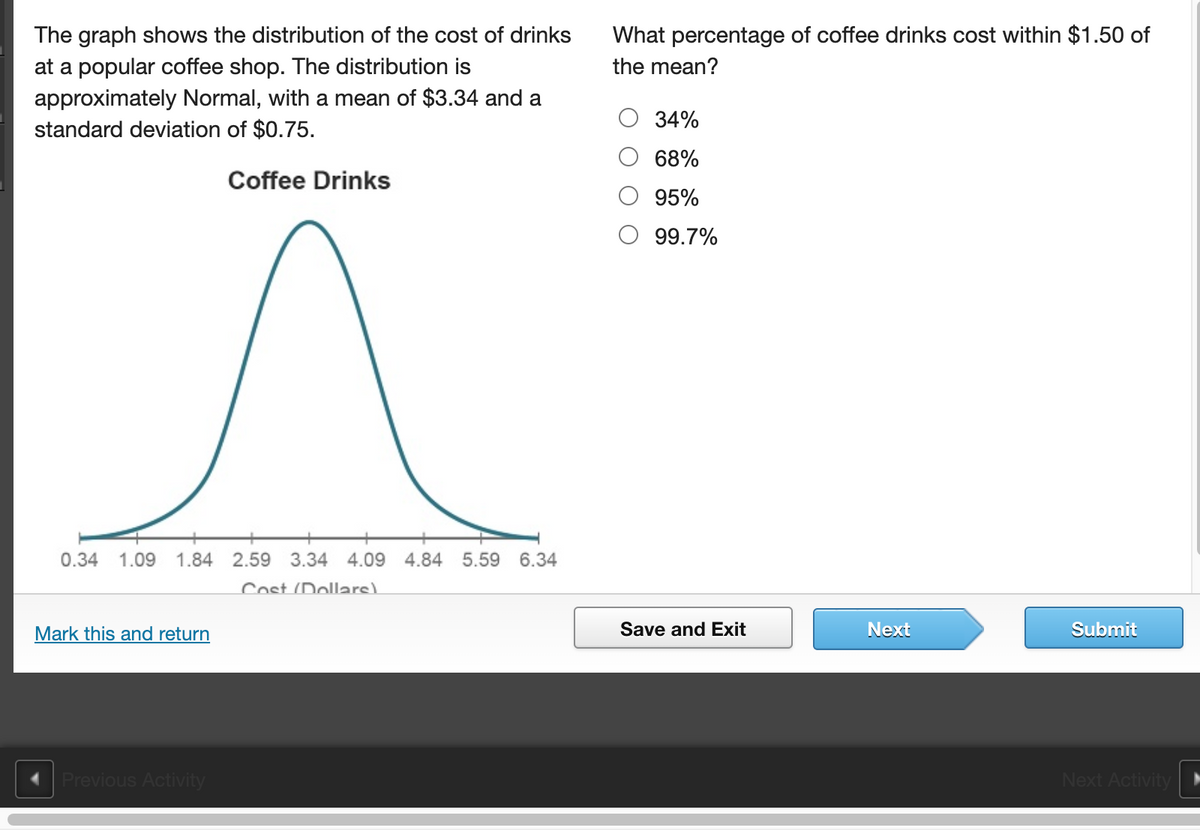
Transcribed Image Text:The graph shows the distribution of the cost of drinks
at a popular coffee shop. The distribution is
approximately Normal, with a mean of $3.34 and a
standard deviation of $0.75.
What percentage of coffee drinks cost within $1.50 of
the mean?
34%
68%
Coffee Drinks
95%
99.7%
0.34
1.09
1.84 2.59 3.34 4.09 4.84 5.59
6.34
Cost (Dollars)
Mark this and return
Save and Exit
Next
Submit
Previous Activity
Next Activity
Expert Solution
Step 1

Trending now
This is a popular solution!

Step by step
Solved in 2 steps with 2 images

Recommended textbooks for you
Glencoe Algebra 1, Student Edition, 9780079039897…
Algebra
ISBN:
9780079039897
Author:
Carter
Publisher:
McGraw Hill
Glencoe Algebra 1, Student Edition, 9780079039897…
Algebra
ISBN:
9780079039897
Author:
Carter
Publisher:
McGraw Hill