The shape of this graph is best described as а. Normal b. Uniform C. Left skewed d. Right skewed 10 20 30 40 50 60 70 80 90 100 A set of data is normally distributed with a mean of 50 and a standard deviation of 4.5. Approximately what percent of data would you expect to be between 41 and 59? a. 34% b. 50% C. 68% d. 95% How many students were greater than 55 inches tall but less than 70 inches tall? Frequency a. 13 b. 15 C. 16 d. 17 50 55 Height (inches) 60 65 70 75 80
The shape of this graph is best described as а. Normal b. Uniform C. Left skewed d. Right skewed 10 20 30 40 50 60 70 80 90 100 A set of data is normally distributed with a mean of 50 and a standard deviation of 4.5. Approximately what percent of data would you expect to be between 41 and 59? a. 34% b. 50% C. 68% d. 95% How many students were greater than 55 inches tall but less than 70 inches tall? Frequency a. 13 b. 15 C. 16 d. 17 50 55 Height (inches) 60 65 70 75 80

Glencoe Algebra 1, Student Edition, 9780079039897, 0079039898, 2018
18th Edition
ISBN:9780079039897
Author:Carter
Publisher:Carter
Chapter10: Statistics
Section10.3: Measures Of Spread
Problem 26PFA

Related questions
Question
100%
Pls help ASAP. and pls answer all questions I BEG PLS ASAP
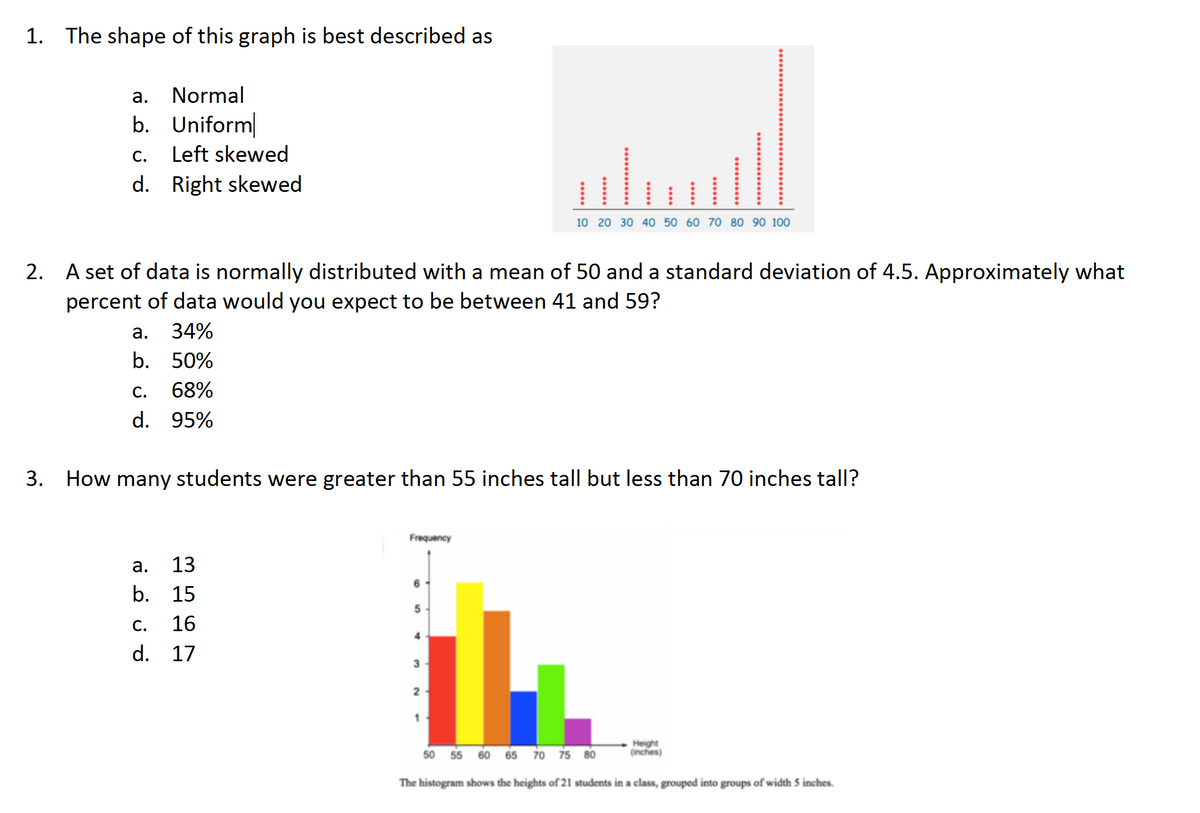
Transcribed Image Text:1. The shape of this graph is best described as
а.
Normal
b. Uniform
С.
Left skewed
d. Right skewed
10 20 30 40 50 60 70 80 90 100
2. A set of data is normally distributed with a mean of 50 and a standard deviation of 4.5. Approximately what
percent of data would you expect to be between 41 and 59?
а.
34%
b. 50%
С.
68%
d. 95%
3. How many students were greater than 55 inches tall but less than 70 inches tall?
Frequency
а.
13
b. 15
5
С.
16
d. 17
1
60 65 70 75 80
Height
(inches)
50
55
The histogram shows the heights of 21 students in a class, grouped into groups of width 5 inches.
Expert Solution
This question has been solved!
Explore an expertly crafted, step-by-step solution for a thorough understanding of key concepts.

This is a popular solution!

Trending now
This is a popular solution!

Step by step
Solved in 2 steps with 1 images

Knowledge Booster


Learn more about
Need a deep-dive on the concept behind this application? Look no further. Learn more about this topic, statistics and related others by exploring similar questions and additional content below.Recommended textbooks for you
Glencoe Algebra 1, Student Edition, 9780079039897…
Algebra
ISBN:
9780079039897
Author:
Carter
Publisher:
McGraw Hill
Glencoe Algebra 1, Student Edition, 9780079039897…
Algebra
ISBN:
9780079039897
Author:
Carter
Publisher:
McGraw Hill