The graph shows the market for corn with a price floor of $7. After the price floor is in place, how many bushels of corn are bought or sold? Supply 9.62- Price floor 7- Demand 8.38 10.86 Quantity (bushels) Price ($)
The graph shows the market for corn with a price floor of $7. After the price floor is in place, how many bushels of corn are bought or sold? Supply 9.62- Price floor 7- Demand 8.38 10.86 Quantity (bushels) Price ($)

Managerial Economics: A Problem Solving Approach
5th Edition
ISBN:9781337106665
Author:Luke M. Froeb, Brian T. McCann, Michael R. Ward, Mike Shor
Publisher:Luke M. Froeb, Brian T. McCann, Michael R. Ward, Mike Shor
Chapter8: Understanding Markets And Industry Changes
Section: Chapter Questions
Problem 8.1IP

Related questions
Question
answer to this q?
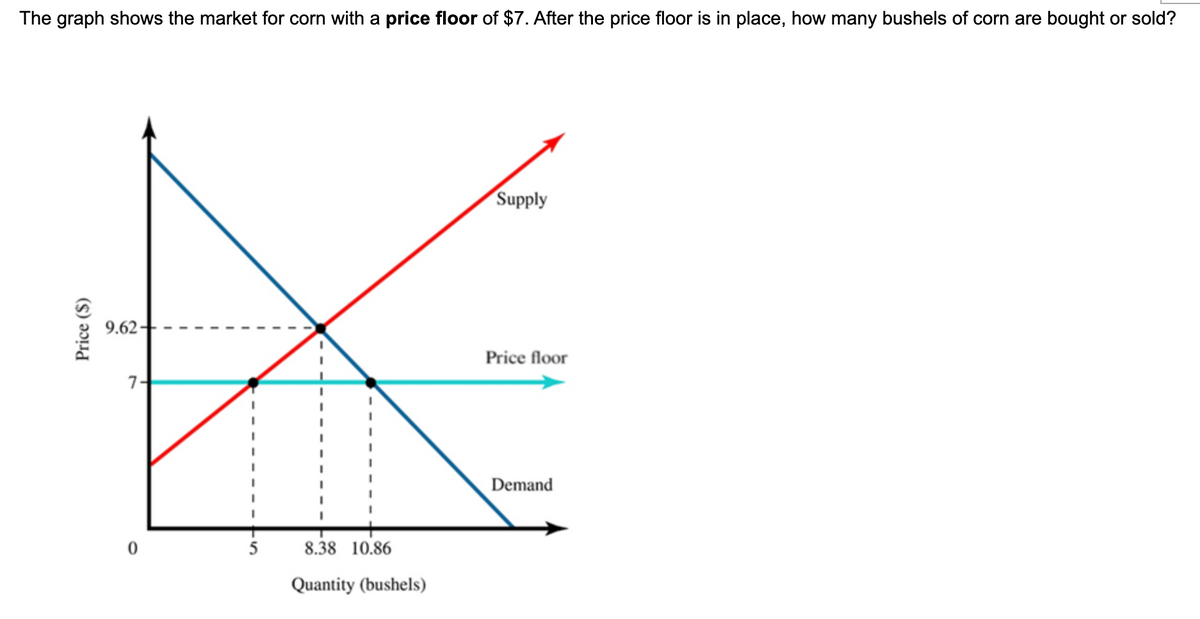
Transcribed Image Text:The graph shows the market for corn with a price floor of $7. After the price floor is in place, how many bushels of corn are bought or sold?
Supply
9.62-
Price floor
7-
Demand
5
8.38 10.86
Quantity (bushels)
Price ($)
Expert Solution
This question has been solved!
Explore an expertly crafted, step-by-step solution for a thorough understanding of key concepts.

This is a popular solution!

Trending now
This is a popular solution!

Step by step
Solved in 2 steps

Knowledge Booster


Learn more about
Need a deep-dive on the concept behind this application? Look no further. Learn more about this topic, economics and related others by exploring similar questions and additional content below.Recommended textbooks for you
Managerial Economics: A Problem Solving Approach
Economics
ISBN:
9781337106665
Author:
Luke M. Froeb, Brian T. McCann, Michael R. Ward, Mike Shor
Publisher:
Cengage Learning


Managerial Economics: A Problem Solving Approach
Economics
ISBN:
9781337106665
Author:
Luke M. Froeb, Brian T. McCann, Michael R. Ward, Mike Shor
Publisher:
Cengage Learning


