The graph shows the remaining life expectancy, E, in years for females of age x What is the average rate of change between ages 50 and 60? What does the average rate of change means in this situation?
The graph shows the remaining life expectancy, E, in years for females of age x What is the average rate of change between ages 50 and 60? What does the average rate of change means in this situation?

Algebra & Trigonometry with Analytic Geometry
13th Edition
ISBN:9781133382119
Author:Swokowski
Publisher:Swokowski
Chapter1: Fundamental Concepts Of Algebra
Section1.4: Fractional Expressions
Problem 8E

Related questions

Question
The graph shows the remaining life expectancy, E, in years for females of age x
What is the average rate of change between ages 50 and 60? What does the average rate of change means in this situation?
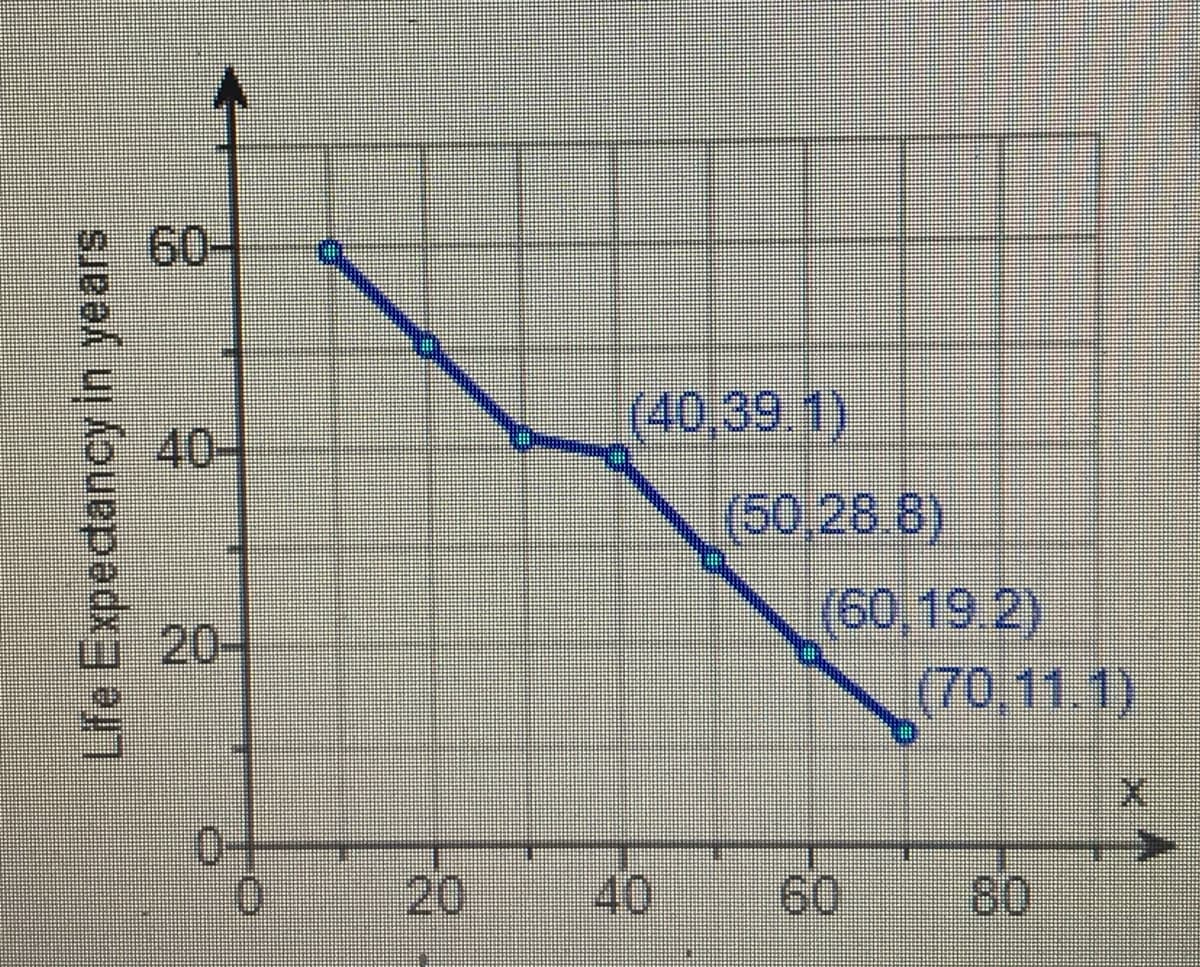
Transcribed Image Text:9
60-
(40,39.1)
6 40
(50,28.8)
(60,19.2)
(70,11.1)
20-
0-
01
20
40
60
80
Lfe Expedtancy in years
Expert Solution
This question has been solved!
Explore an expertly crafted, step-by-step solution for a thorough understanding of key concepts.

Step by step
Solved in 2 steps with 2 images

Knowledge Booster


Learn more about
Need a deep-dive on the concept behind this application? Look no further. Learn more about this topic, algebra and related others by exploring similar questions and additional content below.Recommended textbooks for you
Algebra & Trigonometry with Analytic Geometry
Algebra
ISBN:
9781133382119
Author:
Swokowski
Publisher:
Cengage

College Algebra (MindTap Course List)
Algebra
ISBN:
9781305652231
Author:
R. David Gustafson, Jeff Hughes
Publisher:
Cengage Learning
Algebra & Trigonometry with Analytic Geometry
Algebra
ISBN:
9781133382119
Author:
Swokowski
Publisher:
Cengage
College Algebra (MindTap Course List)
Algebra
ISBN:
9781305652231
Author:
R. David Gustafson, Jeff Hughes
Publisher:
Cengage Learning