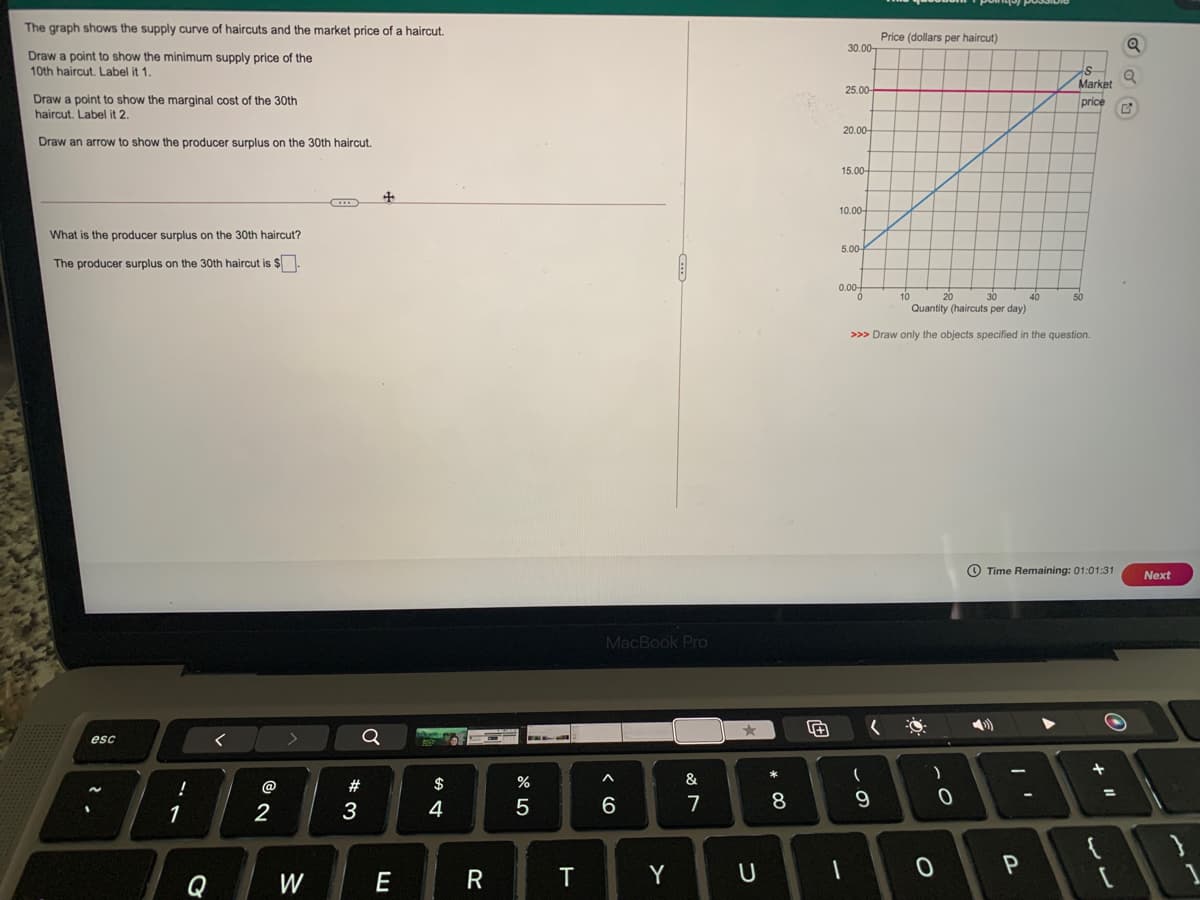
The graph shows the supply curve of haircuts and the market price of a haircut. Price (dollars per haircut) 30.00- Draw a point to show the minimum supply price of the 10th haircut. Label it 1. Market 25.00 Draw a point to show the marginal cost of the 30th price haircut. Label it 2. 20.00- Draw an arrow to show the producer surplus on the 30th haircut. 15.00- 10.00- What is the producer surplus on the 30th haircut? 5.00- The producer surplus on the 30th haircut is $ 0.00- 30 20 Quantity (haircuts per day) 10 40 50 >>> Draw only the objects specified in the question.
The graph shows the supply curve of haircuts and the market price of a haircut. Price (dollars per haircut) 30.00- Draw a point to show the minimum supply price of the 10th haircut. Label it 1. Market 25.00 Draw a point to show the marginal cost of the 30th price haircut. Label it 2. 20.00- Draw an arrow to show the producer surplus on the 30th haircut. 15.00- 10.00- What is the producer surplus on the 30th haircut? 5.00- The producer surplus on the 30th haircut is $ 0.00- 30 20 Quantity (haircuts per day) 10 40 50 >>> Draw only the objects specified in the question.

Essentials of Economics (MindTap Course List)
8th Edition
ISBN:9781337091992
Author:N. Gregory Mankiw
Publisher:N. Gregory Mankiw
Chapter7: Consumers, Producers, And The Efficiency Of Markets
Section7.2: Producer Surplus
Problem 2QQ

Related questions
Question
Question 6 r
Transcribed Image Text:The graph shows the supply curve of haircuts and the market price of a haircut.
Price (dollars per haircut)
30.00-
Draw a point to show the minimum supply price of the
10th haircut. Label it 1.
Market
25.00
Draw a point to show the marginal cost of the 30th
haircut. Label it 2.
price
20.00-
Draw an arrow to show the producer surplus on the 30th haircut.
15.00-
10.00-
What is the producer surplus on the 30th haircut?
5.00-
The producer surplus on the 30th haircut is $
0.00-
10
20
40
Quantity (haircuts per day)
>>> Draw only the objects specified in the question.
O Time Remaining: 01:01:31
Next
MacBook Pro
esc
@
#
$
%
&
%3D
1
2
3
4
6
7
8
P
Q
W
E
R
Y
Expert Solution
Step 1
In a perfect competitive market, the marginal cost of the firm is shown by its supply curve.
Producer surplus is the area above the supply curve and below the market price. It is the benefit received by the seller by the production and selling of a good or service in the market.

Trending now
This is a popular solution!

Step by step
Solved in 2 steps with 1 images

Knowledge Booster


Learn more about
Need a deep-dive on the concept behind this application? Look no further. Learn more about this topic, economics and related others by exploring similar questions and additional content below.Recommended textbooks for you
Essentials of Economics (MindTap Course List)
Economics
ISBN:
9781337091992
Author:
N. Gregory Mankiw
Publisher:
Cengage Learning


Economics (MindTap Course List)
Economics
ISBN:
9781337617383
Author:
Roger A. Arnold
Publisher:
Cengage Learning
Essentials of Economics (MindTap Course List)
Economics
ISBN:
9781337091992
Author:
N. Gregory Mankiw
Publisher:
Cengage Learning
Economics (MindTap Course List)
Economics
ISBN:
9781337617383
Author:
Roger A. Arnold
Publisher:
Cengage Learning


Principles of Microeconomics
Economics
ISBN:
9781305156050
Author:
N. Gregory Mankiw
Publisher:
Cengage Learning