The graph to the right compares teaching salanes and men at private colleges and universities. What impression does the graph create? Does the graph depict the data fairly? If not, construct a graph that depicts the data fairly. A. 80000- Salaries (S) 70000- What impression does the graph create? OA. The graph creates the impression that men and women have approximately the same salaries. OB. The graph creates the impression that women have salaries that are slightly higher than that of men. OC. The graph creates the impression that men have salaries that are more than twice the salaries of women. OD. The graph creates the impression that men have salaries that are slightly higher than that f women. Does the graph depict the data fairly? 80000 60000- 60000- OA. No, because the data are two-dimensional measurements. OB. Yes, because the bars accurately represent each average. OC. No, because the vertical scale does not start at zero. OD. Yes, because the vertical scale is appropriate for the data. f the graph does not depict the data fairly, which graph below does? 50000 Women Men OB. 75000 Salaries (5) OC. Salaries (5) 80000 60000-
The graph to the right compares teaching salanes and men at private colleges and universities. What impression does the graph create? Does the graph depict the data fairly? If not, construct a graph that depicts the data fairly. A. 80000- Salaries (S) 70000- What impression does the graph create? OA. The graph creates the impression that men and women have approximately the same salaries. OB. The graph creates the impression that women have salaries that are slightly higher than that of men. OC. The graph creates the impression that men have salaries that are more than twice the salaries of women. OD. The graph creates the impression that men have salaries that are slightly higher than that f women. Does the graph depict the data fairly? 80000 60000- 60000- OA. No, because the data are two-dimensional measurements. OB. Yes, because the bars accurately represent each average. OC. No, because the vertical scale does not start at zero. OD. Yes, because the vertical scale is appropriate for the data. f the graph does not depict the data fairly, which graph below does? 50000 Women Men OB. 75000 Salaries (5) OC. Salaries (5) 80000 60000-

Glencoe Algebra 1, Student Edition, 9780079039897, 0079039898, 2018
18th Edition
ISBN:9780079039897
Author:Carter
Publisher:Carter
Chapter2: Linear Equations
Section: Chapter Questions
Problem 2PFA

Related questions
Question
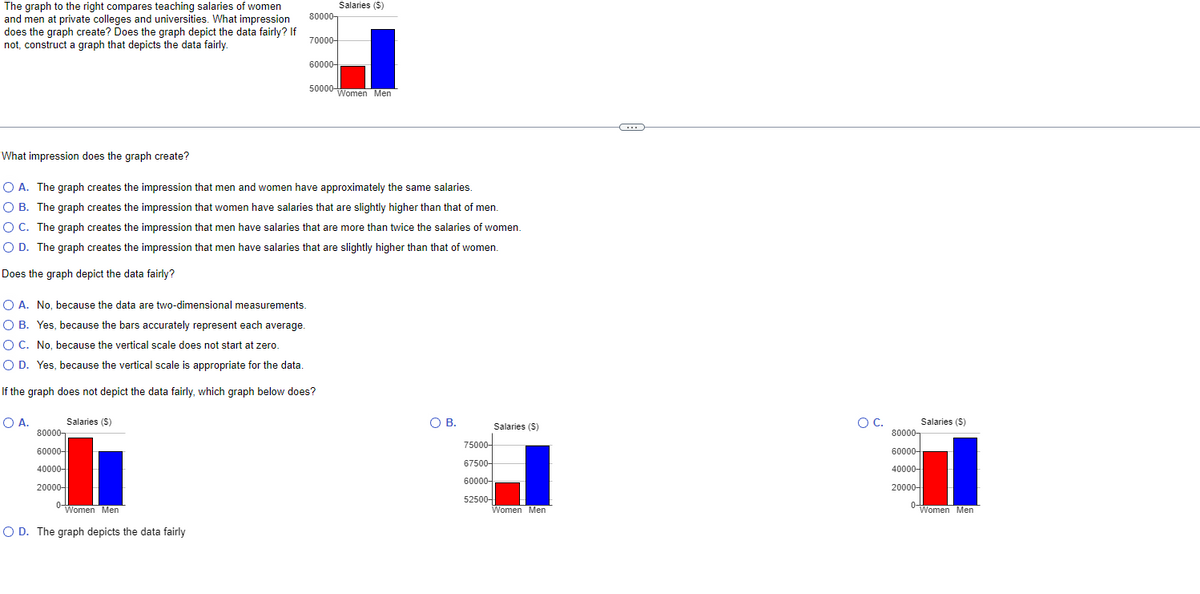
Transcribed Image Text:The graph to the right compares teaching salaries of women
and men at private colleges and universities. What impression
does the graph create? Does the graph depict the data fairly? If
not, construct a graph that depicts the data fairly.
What impression does the graph create?
O A.
Salaries ($)
80000-
60000-
40000-
20000-
80000-
O A. The graph creates the impression that men and women have approximately the same salaries.
O B. The graph creates the impression that women have salaries that are slightly higher than that of men.
O C. The graph creates the impression that men have salaries that are more than twice the salaries of women.
O D. The graph creates the impression that men have salaries that are slightly higher than that of women.
Does the graph depict the data fairly?
O A. No, because the data are two-dimensional measurements.
O B. Yes, because the bars accurately represent each average.
O C. No, because the vertical scale does not start at zero.
O D. Yes, because the vertical scale is appropriate for the data.
If the graph does not depict the data fairly, which graph below does?
04
70000-
Women Men
O D. The graph depicts the data fairly
60000-
Salaries ($)
50000 Women Men
O B.
75000-
67500-
60000-
52500-
Salaries (S)
Women Men
G
O C.
Salaries (S)
80000
60000-
40000-
20000-
0-
Women Men
Expert Solution
This question has been solved!
Explore an expertly crafted, step-by-step solution for a thorough understanding of key concepts.

Step by step
Solved in 2 steps

Recommended textbooks for you
Glencoe Algebra 1, Student Edition, 9780079039897…
Algebra
ISBN:
9780079039897
Author:
Carter
Publisher:
McGraw Hill

Algebra: Structure And Method, Book 1
Algebra
ISBN:
9780395977224
Author:
Richard G. Brown, Mary P. Dolciani, Robert H. Sorgenfrey, William L. Cole
Publisher:
McDougal Littell

Holt Mcdougal Larson Pre-algebra: Student Edition…
Algebra
ISBN:
9780547587776
Author:
HOLT MCDOUGAL
Publisher:
HOLT MCDOUGAL
Glencoe Algebra 1, Student Edition, 9780079039897…
Algebra
ISBN:
9780079039897
Author:
Carter
Publisher:
McGraw Hill
Algebra: Structure And Method, Book 1
Algebra
ISBN:
9780395977224
Author:
Richard G. Brown, Mary P. Dolciani, Robert H. Sorgenfrey, William L. Cole
Publisher:
McDougal Littell
Holt Mcdougal Larson Pre-algebra: Student Edition…
Algebra
ISBN:
9780547587776
Author:
HOLT MCDOUGAL
Publisher:
HOLT MCDOUGAL

College Algebra (MindTap Course List)
Algebra
ISBN:
9781305652231
Author:
R. David Gustafson, Jeff Hughes
Publisher:
Cengage Learning