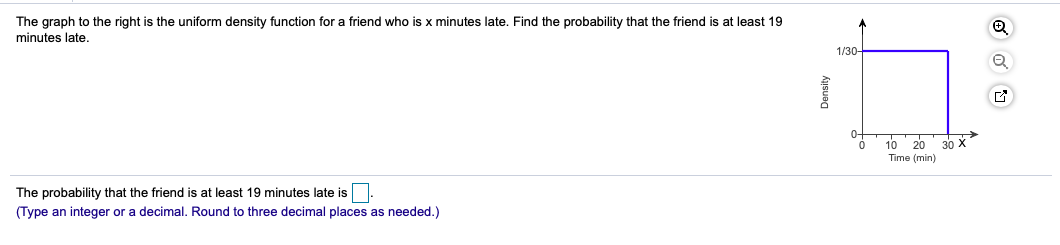
The graph to the right is the uniform density function for a friend who is x minutes late. Find the probability that the friend is at least 19 minutes late. 1/30- 10 Time (min) 30 X The probability that the friend is at least 19 minutes late is (Type an integer or a decimal. Round to three decimal places as needed.)
The graph to the right is the uniform density function for a friend who is x minutes late. Find the probability that the friend is at least 19 minutes late. 1/30- 10 Time (min) 30 X The probability that the friend is at least 19 minutes late is (Type an integer or a decimal. Round to three decimal places as needed.)

Functions and Change: A Modeling Approach to College Algebra (MindTap Course List)
6th Edition
ISBN:9781337111348
Author:Bruce Crauder, Benny Evans, Alan Noell
Publisher:Bruce Crauder, Benny Evans, Alan Noell
Chapter1: Functions
Section1.2: Functions Given By Tables
Problem 2TU: Use the table of values you made in part 4 of the example to find the limiting value of the average...

Related questions
Question
100%
helpp
Transcribed Image Text:The graph to the right is the uniform density function for a friend who is x minutes late. Find the probability that the friend is at least 19
minutes late.
1/30-
10
Time (min)
30 X
The probability that the friend is at least 19 minutes late is
(Type an integer or a decimal. Round to three decimal places as needed.)
Expert Solution
This question has been solved!
Explore an expertly crafted, step-by-step solution for a thorough understanding of key concepts.

This is a popular solution!

Trending now
This is a popular solution!

Step by step
Solved in 3 steps with 3 images

Knowledge Booster


Learn more about
Need a deep-dive on the concept behind this application? Look no further. Learn more about this topic, statistics and related others by exploring similar questions and additional content below.Recommended textbooks for you
Functions and Change: A Modeling Approach to Coll…
Algebra
ISBN:
9781337111348
Author:
Bruce Crauder, Benny Evans, Alan Noell
Publisher:
Cengage Learning
Functions and Change: A Modeling Approach to Coll…
Algebra
ISBN:
9781337111348
Author:
Bruce Crauder, Benny Evans, Alan Noell
Publisher:
Cengage Learning