The graphs show the market labor supply (LS) curve for the country of Littleland. The two graphs show different shifts in the LS curve, from LS1 to LS2. Assume there is no change in the labor demand curve. For each statement, select the graph that illustrates the appropriate shift. Graph A Graph B LS1 LS2 LS2 LSI Quantity of labor Quantity of labor 8:23 PM 46°F 12/15/202 近
The graphs show the market labor supply (LS) curve for the country of Littleland. The two graphs show different shifts in the LS curve, from LS1 to LS2. Assume there is no change in the labor demand curve. For each statement, select the graph that illustrates the appropriate shift. Graph A Graph B LS1 LS2 LS2 LSI Quantity of labor Quantity of labor 8:23 PM 46°F 12/15/202 近

Chapter16: The Markets For Labor, Capital, And Land
Section: Chapter Questions
Problem 8P

Related questions
Question
Transcribed Image Text:Resources
Submit All
Question 22 of 30
<>
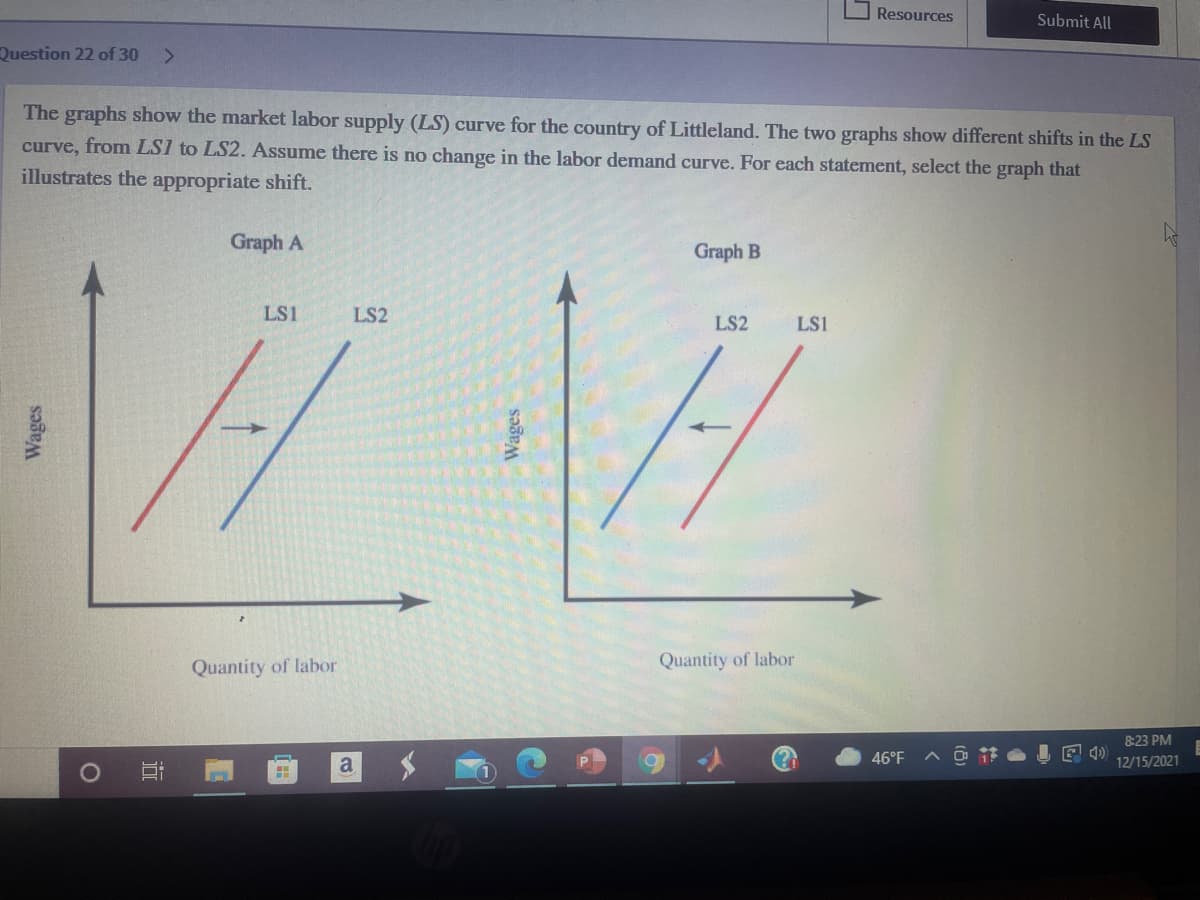
The graphs show the market labor supply (LS) curve for the country of Littleland. The two graphs show different shifts in the LS
curve, from LS1 to LS2. Assume there is no change in the labor demand curve. For each statement, select the graph that
illustrates the appropriate shift.
Graph A
Graph B
LS1
LS2
LS2
LS1
Quantity of labor
Quantity of labor
8:23 PM
a
46°F
12/15/2021
Wages

Transcribed Image Text:Submit
Question 22 of 30
<>
a. The equilibrium wage rate increases.
b. The equilibrium wage rate decreases.
O Graph A
Graph B
O Graph A
O Graph B
c. The government introduces a free childcare policy.
d. Immigration to Littleland increases.
O Graph A
O Graph B
Graph A
O Graph B
f. The birthrate in Littleland decreases.
e. Emigration from Littleland increases.
O Graph A
Graph B
Graph A
Graph B
46°F
Expert Solution
This question has been solved!
Explore an expertly crafted, step-by-step solution for a thorough understanding of key concepts.

This is a popular solution!

Trending now
This is a popular solution!

Step by step
Solved in 2 steps

Knowledge Booster


Learn more about
Need a deep-dive on the concept behind this application? Look no further. Learn more about this topic, economics and related others by exploring similar questions and additional content below.Recommended textbooks for you
Exploring Economics
Economics
ISBN:
9781544336329
Author:
Robert L. Sexton
Publisher:
SAGE Publications, Inc


Exploring Economics
Economics
ISBN:
9781544336329
Author:
Robert L. Sexton
Publisher:
SAGE Publications, Inc

Principles of Microeconomics
Economics
ISBN:
9781305156050
Author:
N. Gregory Mankiw
Publisher:
Cengage Learning

